Curated OER
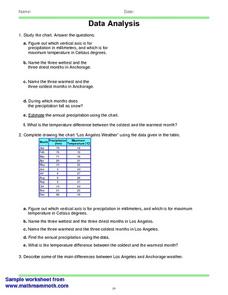
Data Analysis 2
In this data analysis worksheet, students read and interpret given line graphs. They determine the range and average. This one-page worksheet contains five problems.
Curated OER
Review For Test 3
In this test worksheet, students interpret circle graphs, bar graphs, and line graphs. They match graphs to their appropriate linear equation. Students determine the slope of a line. There are 20 problems on this six page worksheet. ...
Curated OER
The Two Coin Problem
In this math worksheet, students look for the answers to the 17 applications of looking at the outcomes of flipping two coins. They also graph the results.
Curated OER
Family Size
In this family size activity, students complete a tally chart to determine data from a family size line plot. They organize the data in the chart to determine the mean, median, mode, and range of the data. There are six problems in...
Curated OER
Food Probability
In this math worksheet, middle schoolers plot the possibilities of outcomes for making sandwiches and ice cream in the graphic organizers.
Curated OER
Possible Outcomes
In this statistics worksheet, learners plot the possible statistical outcomes by examining the data and plotting the missing answer for the four problems.
Curated OER
"M&M's"® Candies Worksheet 2
In this math worksheet, learners plot the mean, median, and mode for the colors of M and M candies by filling in the graphic organizer.
Curated OER
Collecting and Organizing Data
Fifth graders explore methods of generating and organizing data. Afterward, they visit a specified website where they analyze data, organize, and create graphs. Students follow instructions and complete answers to questions. They...
Curated OER
Getting To School: Loving It Or Loathe It?
Students engage in a study looking at the problem of transportation to school. They conduct research using a variety of resources. The information is used in order to work together to come up with possible solutions based upon current...
Curated OER
Doing The School Run
Pupils explore finding the percent of a numbers. They survey their peers to determine modes of transportation used in getting to school. Afterward, students organize information and create graphs and charts. They explore alternative...
Curated OER
Getting A Grip On Graphs
Fourth graders investigate the concept of graphing and comparing different types of data using pictographs, line graphs, scatter plots, etc... They gather data and make interpretations while examining the medium of how it is displayed.
Curated OER
Candy Bar Survey
Second graders investigate the skill of graphing data by using candy bars to create context for the lesson. They use technology for graphing and organizing information like a spreadsheet. The lesson includes a resource link to aid in the...
Curated OER
Sustainability: Our Environment
Young scholars explore the sustainability of our environment, the trend in rising temperatures and the emission of greenhouse cases. Using given data, students test and construct a confidence interval and the difference between two...
Curated OER
Bringing Statistics Alive
Learners compute mean, median and mode and compare mean, median and mode to a real-world application to identify their practical uses. They apply mean, median and mode to real-world statistical data. Finally, students organize data into...
Curated OER
Great Tasting Shapes
Fifth graders investigate the concept of median, mode, and range using a simple model for display purposes. They examine different shaped crackers out of a box and identify the ones that occur the most. Then the calculations for the...
Curated OER
Probability Two Events
Students investigating the concept of probability practice the concept using a variety of different example problems. The instructional activity is delivered in a question and answer format. The frequency of answers is recorded in a data...
Curated OER
Probability Of One Event
Learners investigate the concept of probability. They use example problems in order to measure the likelihood of various outcomes. The lesson includes dialogue to be used by the teacher during direct instruction. They also use class...
Curated OER
Discovering the Middle East (Past & Present)
Students, after being assigned a specific Middle Eastern Country, research various aspects/statistics as well as historical information on their country. They combine their acquired information in an oral presentation and written report....
Curated OER
Significant Science: Statistics for Planet Earth
Ninth graders discover how statistics are used to interpret results of scientific experiments. Students write hypotheses and test the hypotheses by collecting data and organizing the data. Students graph their data to produce a visual....
Curated OER
Making Math Meaningful in March Madness
Middle schoolers examine the statistics of March Madness, the college basketball tournament. They watch videotaped basketball games to collect data for further analysis using Word and Excel. They analyze the data in a variety of...
Curated OER
Classmate Pictograph
Students create pictographs using their classmates in this technology-based lesson plan. The lesson plan uses Inspiration, or Kidspiration, digital cameras, and a downloadable pictograph template.
Curated OER
The Survey Says
Young scholars experience the development of statistical data. In groups, they construct a survey questionnaire for a target audience. Students produce the questionnaire, distribute it, collect it, and tabulate the data. Using EXCEL,...
Curated OER
Vote for Me!
Tenth graders analyze voter trends in South Carolina and discover techniques canddidates and their parties use to convince us to vote their way. They are able to locate voting statistics for their county; compare the number of...
Curated OER
Graphing Population Around the World
Students define specific vocabulary necessary for understanding population data. They collect, analyze, and interpret specific data. They utilize computer programs in order to create graphs of collected data.


