Scholastic
Study Jams! Stem-and-Leaf Plots
Organizing data doesn't have to be boring when you introduce stem and leaf plots to the lesson. In a step-by-step interactive lesson, learners can see how to put data into one of these plots and easily see any patterns. Included are test...
Curated OER
Stemplots
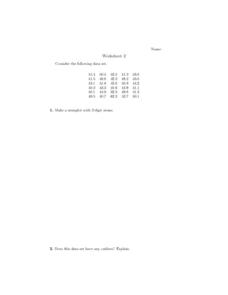
In this stem plot worksheet, students construct 3 stem plots. Students answer 1 question about outliers and another question regarding which stem plot is preferred.
Curated OER
Breakfast Cereal - How Nutritious Is Yours?
Students analyze the nutritional value of breakfast cereal in order to make an informed choice. They create a stem and leaf plot which analyzes the nutritional value of the cereal they eat on a regular basis. Students write a letter to...
Curated OER
Stemmin'-n-Leafin'
Learners make stem and leaf charts to determine the measures of central tendency using test score data. They analyze the data to draw inferences which they share with the class. They complete the associated worksheets.
Curated OER
1-4 Study Guide Integration: Statistics Stem-and-Leaf Plots
In this statistical worksheet, students organize given data into a stem-and-leaf plot. They then use their organize data to answer given questions. Students create two stem-and-leaf plots and answer five questions. An answer sheet is...
Curated OER
Record 'The' Results
Third graders predict how many times they'll see the word "the" in a newspaper page and highlight all the "the"s they find. After reviewing definitions of range, median, mode, mean they create a Stem and Leaf Plot and a Back-to-Back Stem...
Curated OER
Smile Metric Style
Learners explore how to use a metric ruler to measure length, accurately read and record measurements taken in centimeters (cm) and millimeters (mm), and collect and analyze data using a stem and leaf.
Shodor Education Foundation
Shodor Interactivate: Stem and Leaf Plot
Shodor offers this interactive Stem and Leaf Plotter. The mean, median, and mode may be calculated or checked for accurracy with your given data. Be sure to check the "What?" link to find exercises and a lesson plan.
University of Illinois
University of Illinois: Statistics a La Mode
Site from the University of Illinois gives examples using stem and leaf plots to find the mode. It also provides practice examples for students to try. It gives the correct answers and provides a definition of the word mode and where it...


