American Chemical Society
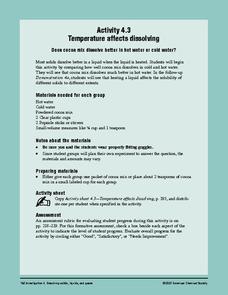
Temperature Affects Dissolving
Stir chocolate drink mix into hot and cold water to see if there is a difference in how quickly it dissolves. Number three in a six-lesson unit on dissolving, this installment investigates the effect of temperature. If you consult the...
Curated OER
My Weather Station
A printable weather station that will blow you away, this includes tools that little meteorologists can use to display their observations of daily weather conditions. There is a gauge where they can slide a pointer to show the...
Scholastic
Study Jams! Heat
Raise the temperature in your class with this hot film! Cartoon teens discuss thermal energy, the conservation and transfer of energy, three methods of heat transfer, conductors, and insulators. The publisher effectively packed every...
Curated OER
Ecosystems and Remote Sensing
Students obtain remote sensing data to compare and contrast global biomass data with global temperature data.
Curated OER
Regents High School Examination: Physical Setting Earth Science 2008
Throughout this earth science exam, high-school geologists complete a series of multiple choice and short answer questions about the solar system, atmosphere, and earth system. This is an amazing test, as are all of the exams developed...
Curated OER
Density of Rocks
Given a variety of rocks, junior geologists calculate densities and correlate them to Earth's layers. As a simulation of continental crust, they experiment with how materials of differing density float in water. Finally, they compare the...
Curated OER
Heat, Temperature, and Transfer
Physical science scholars discover an array of heat sources. They experiment to connect radiation to heat. They begin to understand thermal equilibrium. Then, they test to see if mass affects the rate of temperature change. Choose a few,...
Curated OER
Phase Changes of Water
A micro-unit on the phase changes of water includes three laboratory activities. Junior scientists compare the densities of ice and water, and then they do the same for cold and warm water. They examine freezing and boiling temperatures....
Curated OER
Identifying and Explaining Reactions
Introduce high schoolers to chemical reactions with this series of activities. In a little over an hour, scientists observe four gas-producing reactions: the combination of hydrochloric acid and sodium hydroxide, placing pasta in...
Curated OER
2001 U.S. National Chemistry Olympiad - Local Section Exam
Sixty multiple-choice chemistry questions make up this comprehensive exam used for the 2001 US National Chemistry Olympiad. Every topic that you would expect to approach in a general chemistry class is queried on. You could easily use...
Curated OER
Understanding Behavior of Gases
If you want your young chemists to fully grasp the behavior of gases, here is an all-inclusive lesson plan. It provides handouts of detailed instructions for three laboratory activities, assessment reccomendations, and a list of...
Curated OER
Charles' Law
Students determine the validity of Charles' Law. In this Charles' Law lesson plan, students measure the volumes of a gas at two different temperatures. They determine the volume at a high temperature and predict using Charles' Law what...
Curated OER
Haber's Process- A Computer Simulation
Students use an on line simulation to produce ammonia using Haber's process. In this Haber's process lesson plan, students use a spreadsheet to manipulate the pressure, temperature and catalysts used in the production of ammonia. Their...
Curated OER
Tracking Temperature
Students explore how to read a thermometer and what the instrument does. They practice measuring hot and cold objects and discuss changes in the weather based on temperature.
Curated OER
Make Your Own Temperature Scale
Differentiate between temperature and thermal energy. Your class will build a thermometer using simple materials and develop their own scale for measuring temperature. Discuss with your class and consider why engineers need to understand...
US Department of Energy
Effects of Solar Radiation on Land and Sea
Earth science enthusiasts experiment to compare the heating rates of soil and water. They relate their findings to the weather conditions near bodies of water. Consider also having middle schoolers measure the cooling rates to...
Exploratorium
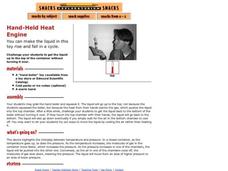
Hand-Held Heat Engine
See the direct relationship between pressure and temperature using these classic science toys. As individuals hold the glass bulb, the liquid inside reaches it's boiling temperature, which is just a bit above room temperature. As the...
Scholastic
Study Jams! Tell Temperature
Weather watchers are introduced to temperature scales using step-by-step animated slides. The Home set explains the Fahrenheit scale on a thermometer, while the Watch Out! set introduces Celsius. A Try It! tab contains two guided...
Scholastic
Study Jams! Tools of Measurement
From temperature and mass, to length and volume, there are many different types of measurement. Expose young learners to a variety of measurement tools using this slide show of real-life pictures. Go through the presentation one image at...
Curated OER
Will There Be a White Christmas This Year?
Students examine historical weather data, and create map and color key that illustrates the likelihood of a white Christmas in different locations across the United States.
Curated OER
Moo-Velous Butter!
Third graders investigate how temperature and motion (energy) create a chemical change that turns cream ( a liquid) into butter (a solid). They create a class pictograph of their favorite mils choices (white, chocolate, or strawberry)...
Curated OER
The Fabled Maine Winter
Learners graph and analyze scientific data. In this research lesson plan students use the Internet to obtain data then draw conclusions about what they found.
Curated OER
Radiation Comparison Before and After 9-11
Using the NASA website, class members try to determine if changes could be detected in cloud cover, temperature, and/or radiation measurements due to the lack of contrails that resulted from the halt in air traffic after the attacks of...
Curated OER
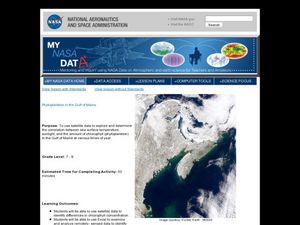
Phytoplankton in the Gulf of Maine
Learners use satellite data to see the correlation between sea temperature and sunlight in the Gulf of Maine. For this phytoplankton lesson students use Excel to analyze data.


