Curated OER
Immigration Graphs
Fourth graders study immigration. In this graphing lesson, 4th graders make a population graph of people who have immigrated to Indiana.
Curated OER
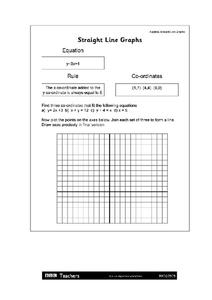
Straight Line Graphs
In this straight line graph instructional activity, students identify linear equations. They plot points of given problems. This one-page instructional activity contains 3 problems.
Curated OER
Variation
In this variation worksheet, students interpret and organize data. They find the distance between points. Students use ratios to determine volume This six-page worksheet contains approximately 20 problems. Answers are provided on the...
Curated OER
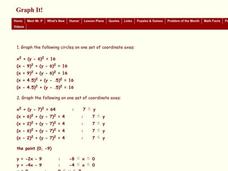
Graph It!
In this graph it worksheet, students graph inequalities on a coordinate plane. This one-page worksheet contains 3 problems.
Curated OER
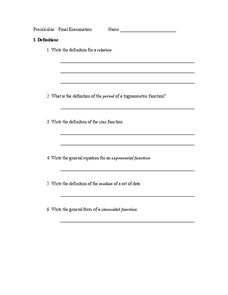
PreCalculus: Final Examination
In this final examination instructional activity, students find the tangent function and sine function. They graph problems on a polar coordinate. Students describe trigonometric properties. This twelve-page instructional activity...
Curated OER
Jumping to Conclusions
Students decide as a class what their data is going to be to graph. In this math lesson, students organize data so that it will be easier to display in a graph. Students are guided through the process by their teachers, and helped with...
Curated OER
Trigonometric Functions
In this trigonometric functions learning exercise, students examine trigonometric functions and graph them. This one-page learning exercise contains 1 multi-step problem and a graph.
Curated OER
Tables and Linear Graphs
In this tables and linear graphs worksheet, students examine linear functions. They solve equations and graph them on a coordinate plane. This four-page worksheet contains 8 multi-step problems. Answers are provided on the last page.
Curated OER
Graphing Review
in this graphing review instructional activity, students solve a variety of problems such as interpreting parabolas, identifying intercepts and asymptotes, and identifying functions. They solve piecewise functions and rational functions....
Curated OER
Pedestrian Safety for Students
Students create a spreadsheet. In this spreadsheet lesson, students take the responses they received from a pedestrian safety survey to create their spreadsheet. Then they turn this information into a graph.
Curated OER
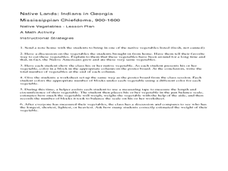
Native Lands: Indian in Georgia
Students bring in vegetables that the Native Americans ate. In this vegetable lesson, students create a graph that shows how many students brought in each vegetable. They measure their vegetable to find the length, circumference, and...
Curated OER
Making an Exercise Graph
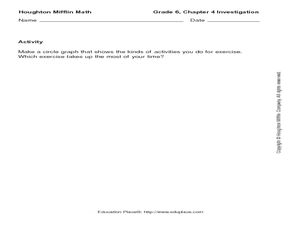
In this making an exercise graph activity, 6th graders draw a circle graph that shows the kinds of activities they do for exercise.
Curated OER
Eye Color
Young scholars take a survey on eye color and plot their findings into a graph. In this eye color lesson plan, students take a class survey of everyone's eye color and learn how to put those findings into a graph.
Curated OER
Using Graphs
For this using graphs worksheet, 9th graders solve and complete 6 different types of problems. First, they determine how the transformation shown moves the graph. Then, students find the interval that is defined given the coordinates....
Curated OER
Recognizing Bias in Graphs
In this bias in graphs worksheet, students examine graphs and explain the data. They determine why the graph is or is not biased. This four-page worksheet contains approximately 6 problems. Explanations and examples are provided.
Curated OER
Graphs of Functions
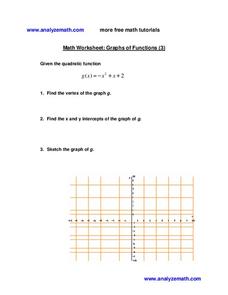
In this graphs of functions worksheet, students identify the vertex, the x and y intercept and graph a quadratic function. This one-page worksheet contains 1 multi-step problem.
Curated OER
IT IS ABOUT SUPPLY AND DEMAND.
Students learn that the price of an item is defined by its supply and demand. In this lesson students graph the relationship between demand and supply of various products, students also consider hidden costs.
Curated OER
Graphing Linear Equations
In this linear equations worksheet, students graph linear equations on a coordinate plane. They identify the slope and the y-intercept. This five-page worksheet contains approximately 36 problems.
Curated OER
Graphs: Scatter Graph
In this scatter graph worksheet, students read and interpret given scatter graphs. They plot ordered pairs and write numbers from least to greatest. This fourteen worksheet contains approximately 18 problems. Some answers are provided on...
Curated OER
Real Life Graphs
In this real life graphs activity, students examine graphs and determine the equation of a line. They interpret distance time graphs and draw graphs to match a real life situations. This three-page activity contains 3 multi-step problems.
Curated OER
Point Graphs
Students experiment with point graphs. In this math lesson, students are divided into groups and perform an experiment to see how high a ball bounces, recording their results on a point graph. Students then answer provided questions.
Curated OER
Motion
In this motion worksheet, students use a position vs. time graph to determine the distance traveled and the velocity at with the object traveled. This worksheet has 2 problems to solve.
Curated OER
Jellybean Graphs
Second graders predict and graph data based on the color of jelly beans they think are in a handful. In this prediction lesson plan, 2nd graders will predict how many of each color jellybean are in a handful. Then they graph these...
Curated OER
Unit III: 3
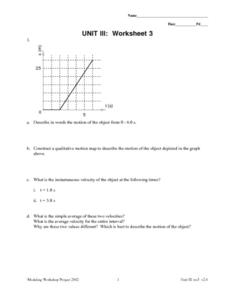
In this unit III: 3 worksheet, students describe motion in words and graph drawings. Students calculate the instantaneous velocity and average velocity. Students also graph the displacement of the object in the word problems.


