Curated OER
Chapter 4 Test: Functions and Integers
In this functions and integers worksheet, students combine positive and negative integers through addition, subtraction, multiplication and division. They complete function tables and graph the results of linear equations. This six-page...
Curated OER
Introducing y = mx + b
Middle and high schoolers use the slope intercept form to graph a line. In this algebra lesson, pupils rewrite equations from standard form to y-intercept form. They use the slope and y-intercept to graph a line without making a table of...
Curated OER
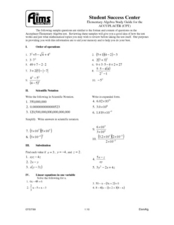
Elementary Algebra Study Guide
Middle and high schoolers solve problems involving linear equations, inequalities, quadratics, radicals, systems of equations, exponents, and polynomials. Many of the problems encompass a review of Algebra I. This 10-page worksheet...
Curated OER
Graphing Linear Equations Cards
OK, so maybe graphing linear equations can be fun. This activity includes a set of linear equation cards to be cut and place face up on a table. Learners pick a card and match it to the correct graph card. This is a really fun way to...
Curated OER
Graphing Linear Equations
Use this graphing worksheet to have learners evaluate and graph linear equations. A coordinate plane, for graphing, is provided below each equation. This one-page worksheet contains seven problems.
Curated OER
Graphs to Represent a Data Set
How many animals did Chaplin see at the zoo? Scholars examine three data sets and create a bar graph for each. Encourage them to label the different parts of their graphs, as this is not prompted on the worksheet. Once they finish their...
Curated OER
Chapters 8 & 9: Functions and Graphing
How many problems can your learners solve without using their calculators? They solve problems containing absolute value, exponents, and rational roots. This three-page worksheet contains 18 multi-step problems, and it was originally...
Curated OER
Senior Analysis: Graphing Rational Functions
Budding mathematicians graph given functions, identify the asymptotes, graph absolute values, and write a table of points. This three-page worksheet contains 23 problems.
Curated OER
Graph Logarithmic Functions
Practice graphing with this learning exercise. High schoolers solve logarithms and graph the solution. This one-page learning exercise contains eight problems, varying in complexity.
Curated OER
Graphs to Represent a Data Set
As your scholars begin to learn how to read graphs, help them pay attention to detail with this matching activity. They read four short data descriptions and match them to one of the four bar graphs pictured. Each graph is labeled along...
Curated OER
Generate Measurement Data Word Problems
Using a set of simple data, learners create a line plot to organize the information. This data includes only single-digit numbers and the highest number is six. Because the answer is explained and illustrated at the bottom, project this...
Curated OER
Long Distance Phone Plans
In this long distance phone plane worksheet, young scholars compare various phone plans and determine which long distance plan has the greatest savings. Students support their answers visually through the use of tables and graphs. They...
Illinois State Board of Education
Is It Linear?
Math apprentices are introduced to the components of a linear relationship. In groups, they write story problems that incorporate this relationship and relates to the real world. They give their problem to the class for them to solve.
Curated OER
Cube Coloring Problem
Upper elementary and middle schoolers describe the various features of unit cubes, such as edges, corners, and faces. They also discuss how to represent measurements of a cube using exponents before engaging in various thinking and...
Curated OER
Interactivate - Lines, Rays, Line Segments, and Planes
Students explore lines, rays, line segments, and planes. In this math activity, students discuss the math concepts and direct their instructor in graphing functions. Students collaborate in graphing additional functions.
Curated OER
Identify and Graph Linear Equations
Learners investigate linear functions. In this mathematics lesson, students plot points onto a graph by solving the equations y=x and y=mx+b by being given numbers for x and solving for y.
Curated OER
Graphing Ordered Pairs
Here is graphing worksheet which has pupils graph ordered pairs and label the axis. They graph five ordered pairs and then interpret the data in the graph.
Curated OER
Using Parallel Axes To Discover Mathematical Interconnections
For this math worksheet, students graph the functions on parallel axes and observe the location of the slope point in relation to the x and y axes.
Curated OER
Creating Tables and Bar Charts
A great way to introduce the concepts of data collection, bar charts, and data analysis. Learners see how their teacher used the data from fifty of her friends to construct a bar chart showing their favorite toys.
Curated OER
Holiday Greeting Cards: A Graphing Activity
Students examine statistics about the popular type of greeting cards and create pie or bar chart using an online tool. They illustrate the sales statistics for the greeting cards before making the charts.
Curated OER
Study Guide: Rational Numbers
In this rational numbers worksheet, students solve and complete 8 different problems that include applying the comparison property and density property for rational numbers. First, they replace each blank with the correct symbol to make...
Curated OER
Linear Equations and Functions - Area and Perimeter
Students use information they know to decorate a room at a reasonable cost by comparing the cost of companies for a decorating job. In this cost lesson plan, students take into consideration the area and perimeter of the room.
Curated OER
All Kinds of Hats Graphing Fun
Where are the hats located? A graphing activity has mathematicians finding coordinates to give exact locations of ten hats scattered on a grid. An example is done for them. Consider showing learners this skill by putting hats around the...
Curated OER
Coordinates on a Shower Curtain: Math
Young scholars use a shower curtain to represent a coordinate plane and then physically demonstrate their understanding or ordered pairs as they move from place to place.


