Curated OER
Are We Couch Potatoes or Busy Bees? Data Analysis of Physical Activity in School
Young scholars study practical data analysis within the constraints of the scientific method. In this data lesson plan students collect and enter data into a computer spreadsheet then create graphs.
Curated OER
Creating Graphs
This graphing PowerPoint demonstrates how to use graphs to gather information. The slides contain examples of graphs and display the data clearly. This presentation also gives clear directions on how to construct various graphs by using...
Curated OER
How’s My Estimating?
In this algebra worksheet, students complete two tables of information comparing their estimate versus actual amount with the aid of a graphing calculator. There are 12 questions.
Curated OER
Froot Loop Graph
In this froot loops graph instructional activity, students graph the colors of the fruit loops they have. Students graph 6 colors of fruit loops on the graph.
Curated OER
Which Car Should I Buy?
Students use gas mileage of different cars to create T charts, algebraic equations, and graphs to show which gets better mileage. In this gas mileage lesson plan, students use the graph to see which car they should buy.
Curated OER
Practice Exam Part 1: Vocabulary
In this geometry worksheet, students practice constructing a variety of graphs with various degrees of vertices. Students determine whether 12 graphs have an Euler circuit or path.
Curated OER
Ellipses (Part 1)
Students work with Ellipses in Algebra II. In this algebra lesson, students solve an equation with a radical expression. They graph ellipses and write an equation for them.
Curated OER
Boots
In this graphing practice worksheet, 5th graders plot squares on a graph with an x and y axis. Once students locate each square they must color a certain design in that box to create a larger picture.
Curated OER
Area of Polygons #2
In this area of polygons worksheet, students find the area of rectangles. They find the width when given the area. Students graph rectangles and solve word problems involving rectangles. This three-page worksheet contains 13...
Curated OER
Spaghetti Palace
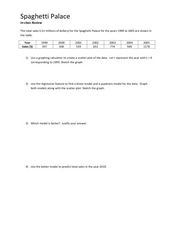
In this spaghetti palace learning exercise sheet, students examine data and create a scatter plot. They use their graphing calculator to find a linear model and a quadratic model for given information. Students predict total sales. ...
Curated OER
Graphs and Derivatives
In this graphs and derivatives worksheet, students graph the derivative of a function. They find the intervals and identify the maximum and minimum. This one page worksheet contains three multi-step problems.
Curated OER
Linear Relations
In this linear relations worksheet, students complete a table for given functions. They classify graphs as linear or non-linear. Students graph given equations. They compare and contrast graphs. This nine page worksheet contains five...
Curated OER
Graphing Lines
For this graphing lines worksheet, learners graph lines that are in the point-slope form. They identify the y-intercept and the slope. They graph the equation of a line on a coordinate plane. This four-page worksheet contains 12...
Curated OER
Chapter 7. Functions and Graphs
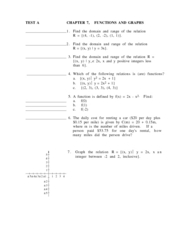
In this functions and graphs worksheet, students determine the domain and range of a given relation. They graph functions on a coordinate plane and write equations in the slope-intercept form. This twelve page worksheet contains 30...
Curated OER
Graphs, Equations and Inequalities
In this graphs, equations and inequalities worksheet, high schoolers graph inequalities. They read graphs and interpret them. Students draw curves with equations. This 12 page worksheet contains approximately 70 problems. Answers are...
Curated OER
It's My Time!
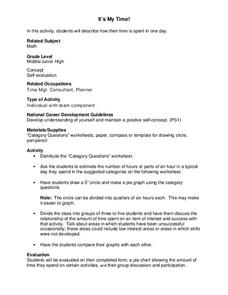
Students create a pie chart. In this time lesson, students determine the amount of time they spend on given activities. They create a pie chart diagraming the data. Students share their graphs with the class.
Curated OER
Graphing It Out
Students create bar graphs. In this graphing instructional activity, students explore the concepts of net pay, gross pay, income and expenses. They create a bar graph to designate financial outlay during a specified period.
Curated OER
All That Corn
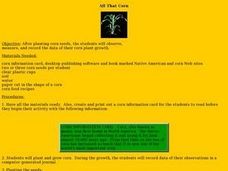
Students observe and record data. In this plant growth lesson, students plant and grow corn. Students observe the growth of their corn and record their data. Students read corn recipes and select their favorite four recipes to write...
Curated OER
Creating a Spreadsheet and Graph
Students create graphs in Excel. In this spreadsheet lesson, students input data into spreadsheet cells then use the graphing feature of the Excel program to produce colorful graphs of the data. The directions to create the graph are...
Curated OER
Absolute Value Inequalities
In this absolute value inequalities worksheet, students solve given inequalities and graph their solution. This four-page worksheet contains 26 problems. Answers are provided on the last two pages.
Curated OER
Excel for Beginners
In this Excel lesson, learners set a formula to check their homework. Students also use clipart, work in groups, and learn to use the tools in the drop-down list.
Curated OER
Graphs, Stories, And Games
In this graphs lesson, students read stories and present story situations on a graph. They explore distance and diameter and explain graphs. Students create their own stories to fit graphs.
Curated OER
Inequalities and Their Graphs
In this inequalities and graphs learning exercise, students draw graphs for given inequalities. They identify less than, greater than, less than or equal to and greater than or equal to. Students write inequalities for given graphs. This...
Curated OER
Multi-Step Inequalities
In this multi-step inequalities activity, students solve inequalities for the unknown. They graph the solution on a number line. This four-page activity contains 24 multi-step problems. Answers are provided on the last page.


