Curated OER
Create a Graph Online
Scholars create colorful bar, line, or pie graphs. They decide on a survey question to ask or a type of data to gather. From there, they collect information and data. They display this data in bar, line, or pie graphs that they create...
Curated OER
Scatter-Brained
Seventh graders graph ordered pairs on a coordinate plane. They create a scatterplot. Additionally, they determine the line of best fit and investigate the slope of the line. Multiple resources are provided. An excellent resource!
Curated OER
All Systems Go!
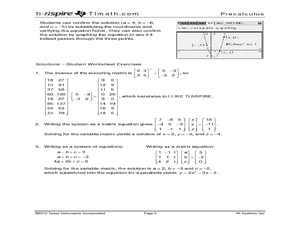
Secret codes are so much fun, and a great way to practice nearly any math skill. Let your class become code breakers as they investigate inverse matrices. They use TI-Nspire technology to solve systems of equations which help them crack...
Curated OER
Murder in the First Degree - The Death of Mr. Spud
Secondary learners investigate exponential functions in a real-world scenario. They collect data on the temperature of a cooling baked potato, enter the data into lists, and graph the data using a scatter plot before finding an...
Curated OER
Understanding Fractions
In this recognizing fractions worksheet, students observe explanations and examples of pie charts and bars and use them to color, write the fraction of the shaded part, and draw and color pie charts. They will solve thirty-two problems.
Curated OER
Multiplying Polynomials
Investigate polynomial multiplication with the TI-nspire handheld calculator. Using the applications on this calculator, learners explore multiplication of numbers, binomials, a binomial by a polynomial, and polynomials. The dynamic...
Curated OER
Using a Hundreds Chart
Youngsters participate in three activities using the hundreds chart. They will choose numbers to add up to one hundred. Whoever gets the most combinations wins. Two variations of the game are supplied.
Curated OER
Go Fish
Help learners discover methods to estimate animal population. They will participate in a simulation of catching and tagging fish in order to estimate the fish population. They scoop and count goldfish crackers, record data, and use...
Curated OER
Book Title: Great Estimations
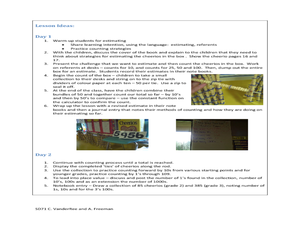
Explore estimation with your math class. They will estimate how many Cheerios are in a box. Then count and group 50 Cheerios on a twist tie and attach groups to represent hundreds. They then discuss and practice skip counting and revise...
Teachers Network
A World of Symmetry: Math-Geometry
Define and identify the three basic forms of symmetry translation, rotation, and glides with your class. They cut out and arrange paper pattern blocks to illustrate symmetry, create a Cartesian graph, and design a rug with a symmetrical...
Utah Education Network (UEN)
Sensational Subtraction Centers
Engage your kindergarteners in a center-based lesson which provides experience and exposure to the connecting and symbolic levels of subtraction. This excellent lesson has many wonderful activities and handouts included for each of the...
Curated OER
It's Not All Greek to Me
Learners find out the meaning for prefixes used in math vocabulary. By dissecting words used in everyday math, they figure out what the prefix indicates and what the word means. A variety of well-organized worksheets and activities...
Curated OER
Visualizing Multiplication
Upper graders represent multiplication of a two-digit number by a two-digit number as the area of a rectangle with dimensions of the two factors. They find patterns for the number of different base ten blocks in a rectangle representing...
Curated OER
Map Your School
Learners participate in a project to map their school. They measure and graph various areas around the school. Learners find the longitude and latitude of the school and research the school's history, and highlight special important areas.
Curated OER
Data and Probability: What is the Best Snack?
In this math/nutrition lesson, the nutritional value of 3 snack foods is recorded on a data chart and represented on a bar graph. Students analyze and compare information, construct data charts and related bar graphs, and draw...
Curated OER
Making Money and Spreading the Flu!
Paper folding, flu spreading in a school, bacteria growth, and continuously compounded interest all provide excellent models to study exponential functions. This is a comprehensive resource that looks at many different aspects of these...
Beacon Learning Center
The Fun Polygon
Junior geometers use hands-on manipulatives to explore and describe the properties and attributes of a fundamental polygon, the triangle. They learn different kinds of angles and their measurements. This well-written lesson plan provides...
Curated OER
Just a Minute!
Students put the standard measure of clock time -- the minute -- in perspective. This lesson can be modified for virtually any grade level. They write about what they learned about a minute as a result of the activities.
Curated OER
It's All in the Measurements
Study customary measurements with your sixth graders. They will investigate linear and capacity measurements to then measure and convert linear and capacity units. Finally they will work in small groups to conduct experiments. Resources...
Curated OER
How Long Does It Take?
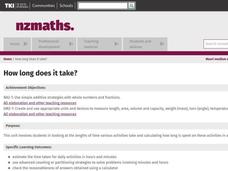
Students investigate the lengths of time various activities take and calculate how long is spent on these activities in a week. They complete a worksheet for each activity that is timed, and calculate lengths of time for simulated...
Curated OER
Count Coins and Bills
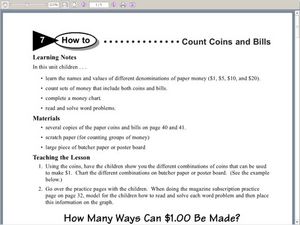
Lower graders recognize coins and paper money and understand its value. They participate in a variety of money problems to appreciate the value of money. Students add, subtract, chart and solve money problems.
Curated OER
Telling Time
First graders play a fun game while learning to tell time. This BBC site is well designed. They enjoy it while learning a lot. Playing in pairs would be lots of fun.
Curated OER
Marshmallow Geometry
In this three-dimensional shapes geometry lesson, learners identify geometric solids and name their properties. They define "face," "edge," and "vertex," and construct geometric solids using marshmallows as vertices and toothpicks as edges.
Curated OER
Place Value & Picasso
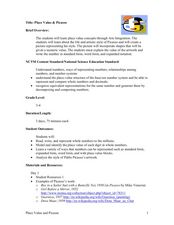
Place value to the millions is the focus of this math lesson. Third and fourth graders investigate multiple ways to represent a number. They examine place value while studying factual information about Pablo Picasso. Resources are provided.


