PBS
Pbs Learning Media: A Flooding Threat
In this video segment from Cyberchase, the CyberSquad uses a graph to estimate how much the water level will rise in the Sensible Flats reservoir.
Richland Community College
Richland Community College: Algebra Lecture Notes
This site from Richland Community College provides lecture notes to a class on Algebra. It covers a wide array of topics including functions, quadratic equations, inequalities, and much more.
University of South Florida
Florida Center for Instructional Tech: Walking the Plank
Students use weight to collect data and investigate the linear relationship. This activity uses a graphing calculator.
PBS
Pbs Learning Media: Digit in Pursuit
The CyberSquad tracks Digit's position in time and then studies graphs to figure out what Hacker is scheming in this video from Cyberchase.
PBS
Pbs Learning Media: Raising the Bar
Harry and Bianca's new boss at a concession stand uses bar graphs to keep records of their refreshment sales in this video from Cyberchase.
Science Education Resource Center at Carleton College
Serc: Exploring Regional Differences in Climate Change
Students create a set of graphs that facilitate comparison of climate change predicted for various states. They also use Microsoft Excel to create a graph showing precipitation data.
University of Vienna (Austria)
The Graphs of Sin, Cos, and Tan Maths Online
This applet allows the user to create the graphs of sin, cos, and tan by moving a scroll bar. The user can watch the unit circle and the graph simultaneously to see how the two are related. The user may also choose to see the angle...
University of Texas
Inside Mathematics: Parking Cars [Pdf]
This task challenges a student to use their understanding of scale to read and interpret data in a bar graph.
University of Texas
Inside Mathematics: Granny's Balloon Trip [Pdf]
This task challenges a student to use knowledge of scale to organize and represent data from a table on a graph.
Other
Numbers, Constants, and Computation: The Logarithm Constant : Log(2)
This site explains The logarithm constant : log(2). It is a very comprehensive site.
University of Auckland School of Computer Science
Morris: Graphs
A description of the graph data structure and how it is used to solve certain types of problems.
California State University
Cal State, San Bernadino: Hyperbolas
An excellent site describing the equations for hyperbolas, including graphs of hyperbolic functions and multiple exercises for practice.
TeachEngineering
Teach Engineering: Using Graph Theory to Analyze Drama
Students analyze dramatic works using graph theory. They gather data, record it in Microsoft Excel and use Cytoscape (a free, downloadable application) to generate graphs that visually illustrate the key characters (nodes) and...
TeachEngineering
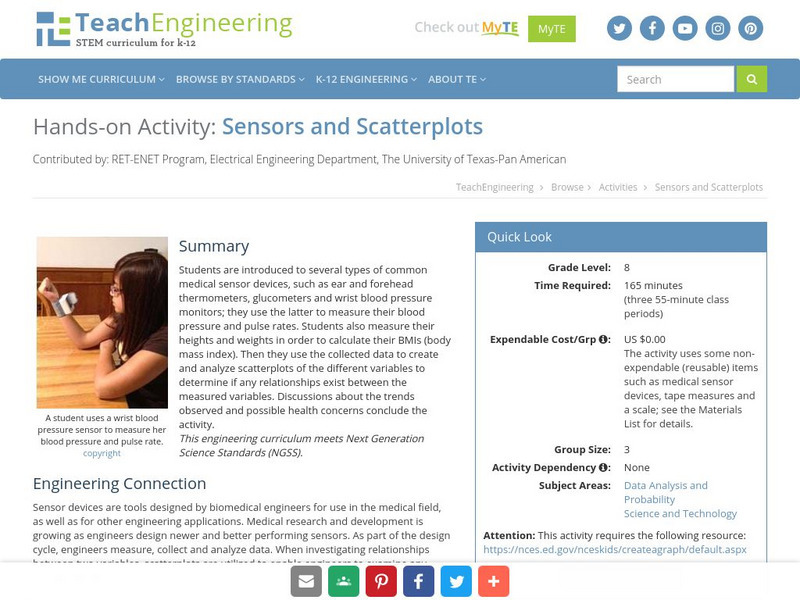
Teach Engineering: Sensors and Scatterplots
Students explore the use of several biomedical engineering sensor devices, and then use the collected data to create and analyze scatterplots of the different variables to determine if any relationships exist between the measured...
TeachEngineering
Teach Engineering: Flood Analysis
Students learn how to use and graph real-world stream gage data to create hydrographs and calculate flood frequency statistics. They also learn how hydrographs help engineers make decisions and recommendations to community stakeholders...
TeachEngineering
Teach Engineering: Graphing Your Social Network
Students analyze their social networks using graph theory. They gather data on their own social relationships, either from Facebook interactions or the interactions they have throughout the course of a day, recording it in Microsoft...
TeachEngineering
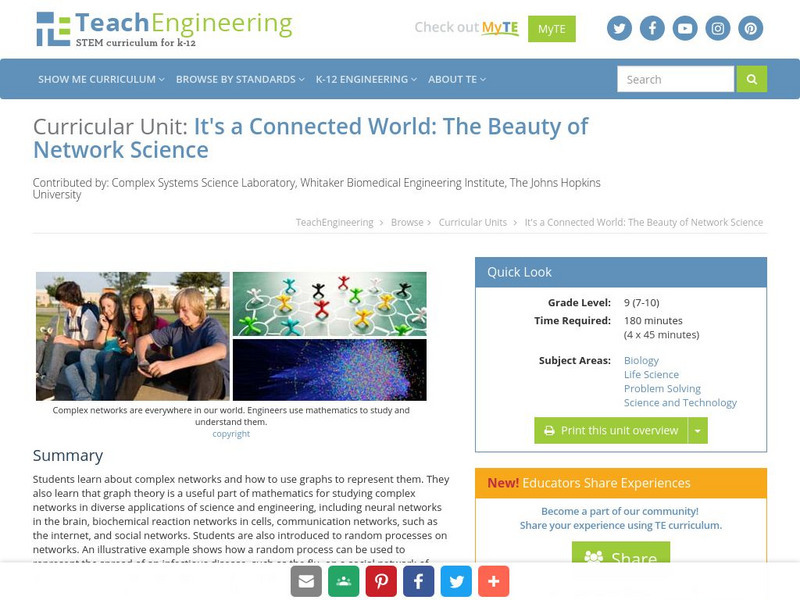
Teach Engineering: It's a Connected World: The Beauty of Network Science
Students learn about complex networks and how to use graphs to represent them. They also learn that graph theory is a useful part of mathematics for studying complex networks in diverse applications of science and engineering, including...
TeachEngineering
Teach Engineering: Latex Tubing and Hybrid Vehicles
This unit gives students the opportunity to make use of linear models in order to make predictions based on real-world data. Students experience how engineers address incredible and important design challenges through the use of linear...
TeachEngineering
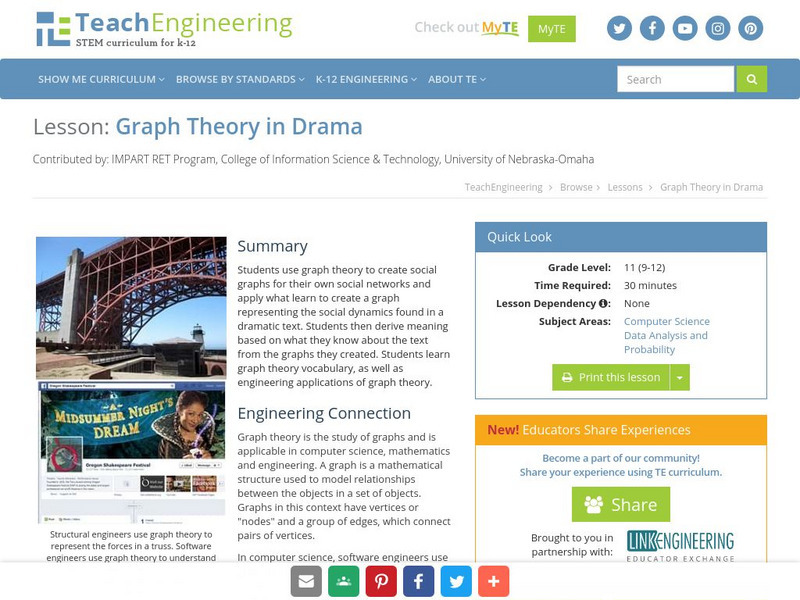
Teach Engineering: Graph Theory in Drama
Students use graph theory to create social graphs for their own social networks and apply what learn to create a graph representing the social dynamics found in a dramatic text. Students then derive meaning based on what they know about...
TeachEngineering
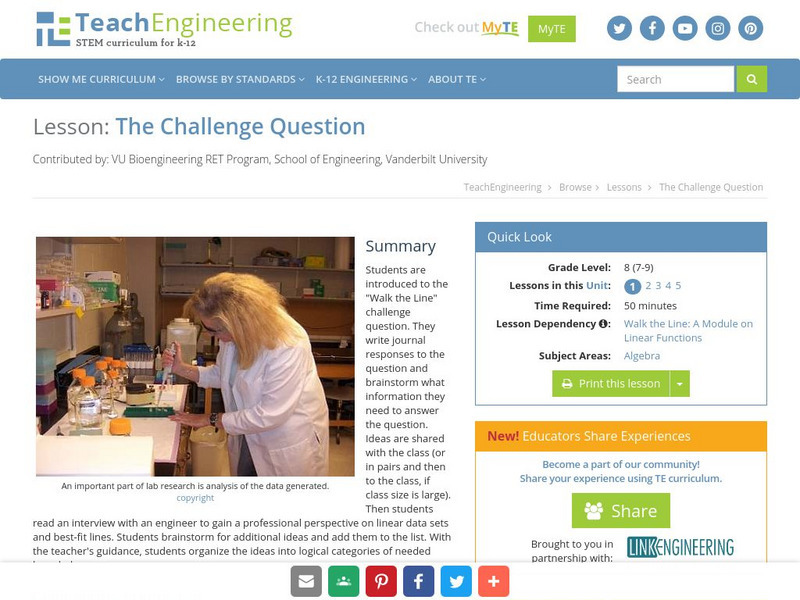
Teach Engineering: The Challenge Question: "Walk the Line"
Students are introduced to the "Walk the Line" challenge question. They are asked to write journal responses to the question and brainstorm what information they need to answer the question. Ideas are shared with the class (or in pairs...
TeachEngineering
Teach Engineering: Coordinates and the Cartesian Plane
A brief refresher on the Cartesian plane includes how points are written in (x,y) format and oriented to the axes, and which directions are positive and negative. Then students learn about what it means for a relation to be a function...
TeachEngineering
Teach Engineering: Graphing Equations on the Cartesian Plane: Slope
The lesson teaches learners about an important characteristic of lines: their slopes. Slope can be determined either in graphical or algebraic form. Slope can also be described as positive, negative, zero or undefined. Students get an...
TeachEngineering
Teach Engineering: Forms of Linear Equations
Students learn about four forms of equations: direct variation, slope-intercept form, standard form and point-slope form. They graph and complete problem sets for each, converting from one form of equation to another, and learning the...
TeachEngineering
Teach Engineering: Applications of Linear Functions
This lesson culminates the unit with the Go Public phase of the legacy cycle. In the associated activities, students use linear models to depict Hooke's law as well as Ohm's law. To conclude the lesson, students apply they've learned...


