Texas Education Agency
Texas Gateway: Graphing Data to Demonstrate Relationships
Given problem situations, the student will graph data with a constant rate of change to demonstrate relationships in familiar concepts, such as scaling.
Texas Education Agency
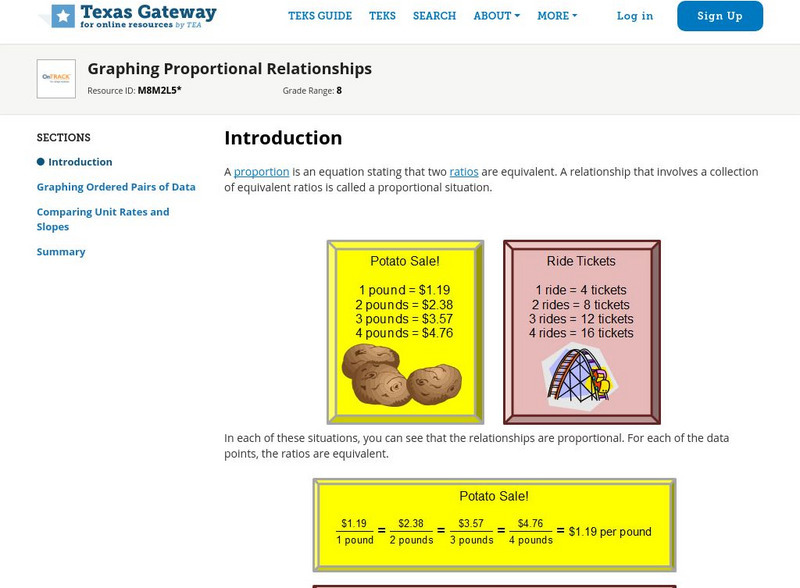
Texas Gateway: Graphing Proportional Relationships
Given a proportional relationship, students will be able to graph a set of data from the relationship and interpret the unit rate as the slope of the line.
Texas Education Agency
Texas Gateway: Making Inferences/convincing Arguments About Samples/populations
Given problem situations that include given or collected data, the student will analyze the data and make inferences and convincing arguments based on the data.
Utah Education Network
Uen: 1st Grade Act. 14: Who's in Your Family
This lesson plan engages students in reading comprehension strategies related to Carol A. Johnson's book, Who's in Your Family. Students will create a classroom graph with the titles of their family members afterward.
Utah Education Network
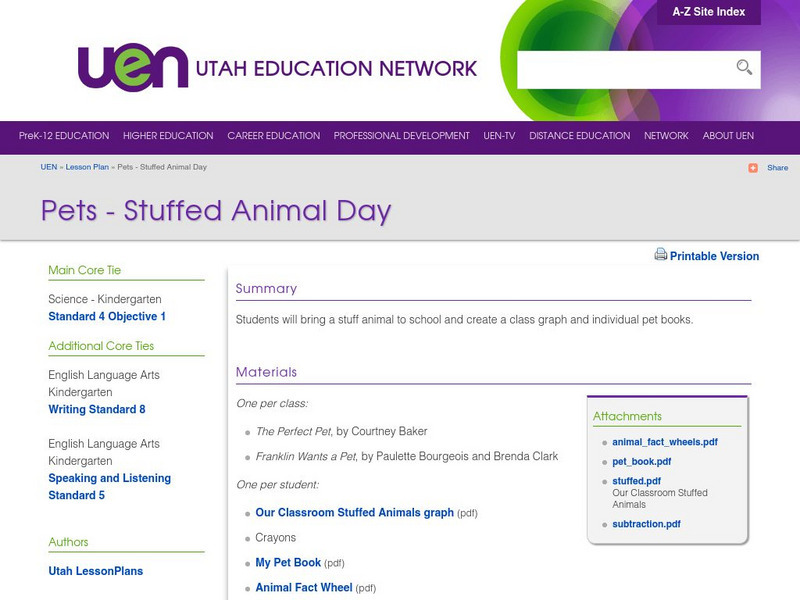
Uen: Pets: Stuffed Animal Day
This lesson plan requires students to bring a stuffed animal to school. During the lesson plan, students will create a class graph and individually author their own nonfiction pet books after conducting research.
Utah Education Network
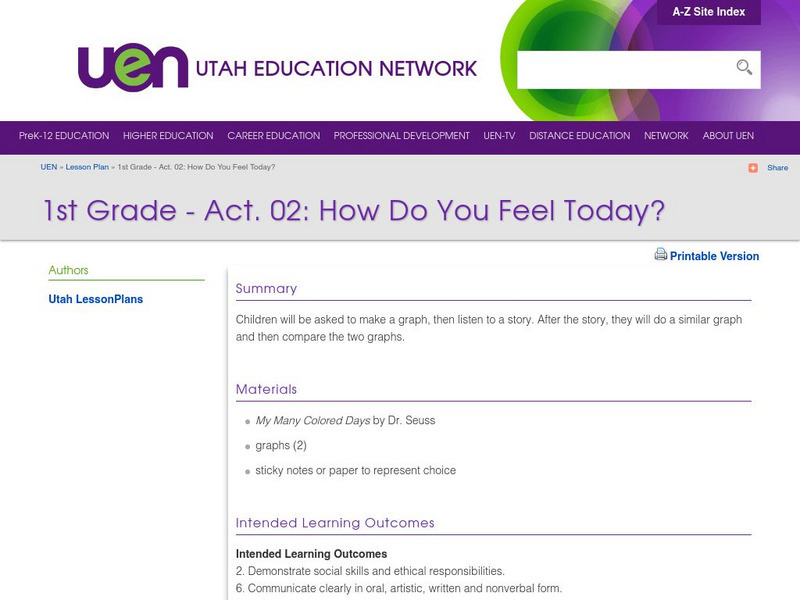
Uen: 1st Grade Act. 02: How Do You Feel Today?
This lesson engages students in self-assessing their feelings. Students will make a graph about their feelings and then listen to Dr. Seuss' book, My Many Colored Days. Students will reflect on the book, make a similar graph, and then...
Texas Education Agency
Texas Gateway: Graphing Data to Demonstrate Relationships
Given problem situations, the student will graph data with a constant rate of change to demonstrate relationships in familiar concepts, such as scaling.
National Council of Teachers of Mathematics
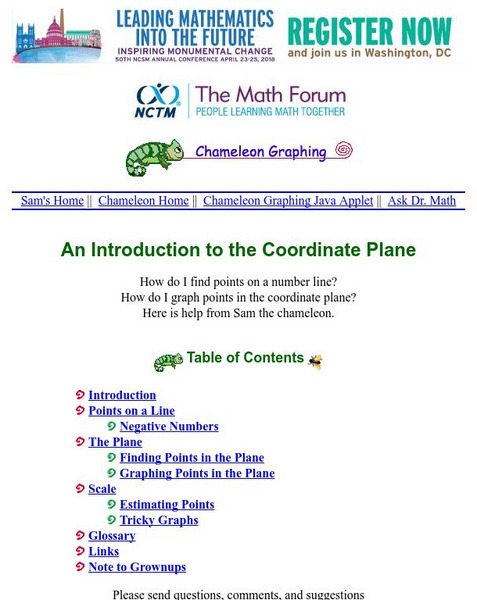
The Math Forum: Chameleon Graphing: Coordinate Plane
Dive into this introduction to graphing in the coordinate plane, and meet a chameleon named Sam. Sam will help guide you through graphing points on a line, using negative numbers, and graphing points in the coordinate plane.
Texas Education Agency
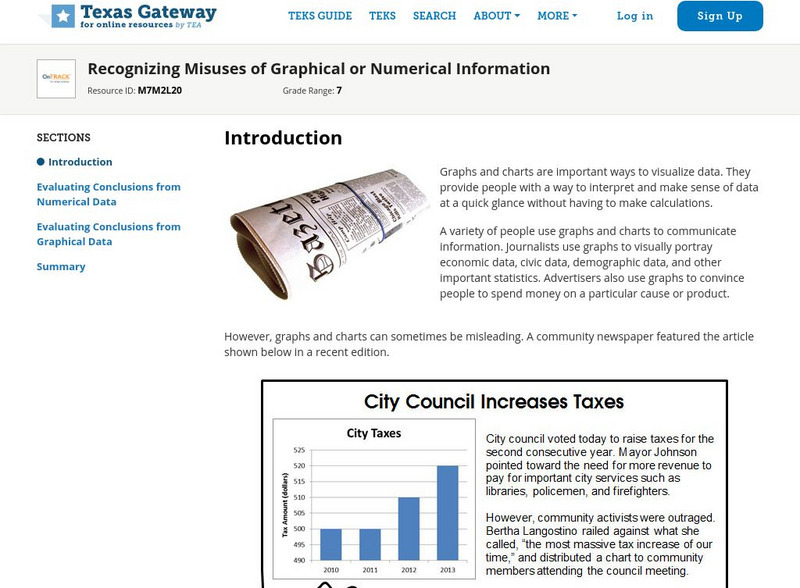
Texas Gateway: Recognizing Misuses of Graphical or Numerical Information
Given a problem situation, the student will analyze data presented in graphical or tabular form by evaluating the predictions and conclusions based on the information given.
University of Colorado
University of Colorado: Ph Et Interactive Simulations: Calculus Grapher
Draw a graph of any function and see graphs of its derivative and integral. Don't forget to use the magnify/demagnify controls on the y-axis to adjust the scale.
Northeast Parallel Architectures Center, Syracuse University
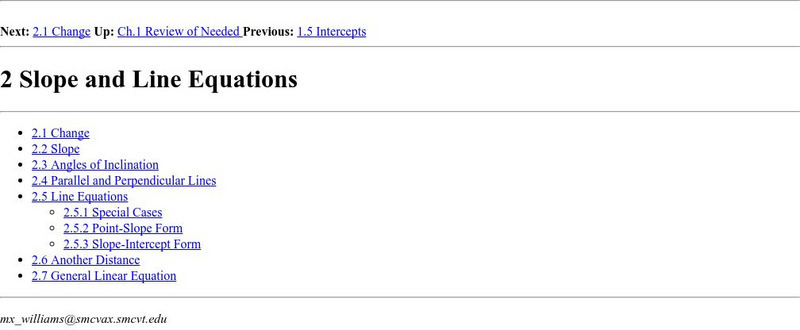
Npac Reu Program: Slope & Line Equations
This site from the Northeast Parallel Architectures Center, Syracuse University has a very substantial discussion of math topics slope & line equations. The outline form is quite useful if you need to zero in on one aspect of...
National Council of Teachers of Mathematics
The Math Forum: Lines and Slope: Chameleon Graphing
Join Joan the chameleon in an exploration of lines and slope. You'll be drawing lines, calculating slope, using equations and more!
Texas Education Agency
Texas Gateway: Scientific Investigation and Reasoning Data Organization
Using interactive exercises, students will review how to construct tables and graphs in order to organize data.
University of North Carolina
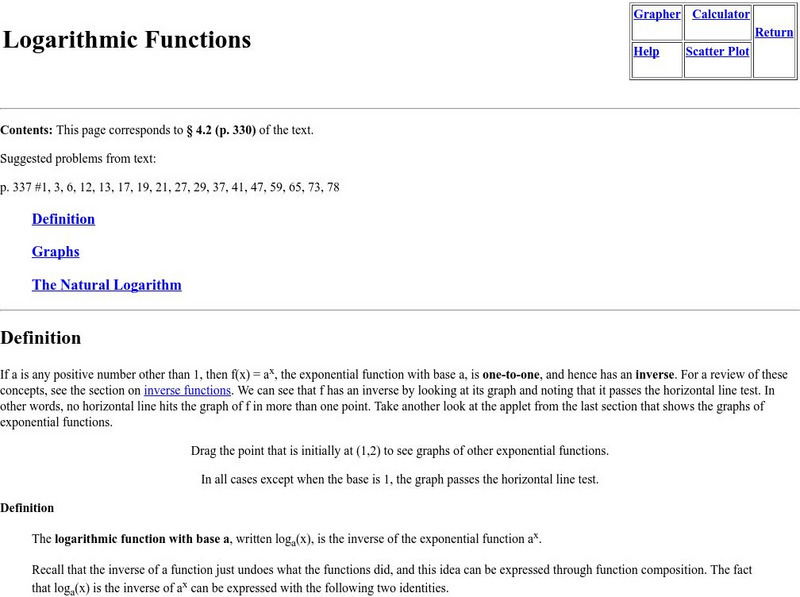
University of North Carolina Wilmington: Logarithmic Functions
Defines logarithmic functions, offers interactive graphs of exponential equations, and explains natural logarithms.
Other
Desmos: Will It Hit the Hoop?
Students explore projectile motion in this activity as they look at videos and predict whether basketballs will land in the hoop. They then show their predictions in graphs of parabolic curves and compare their predictions to the actual...
PBS
Pbs Learning Media: Earning 100 Snelfus
In this Cyberchase video segment, the CyberSquad figures out how to earn 100 snelfus in 11 days.
Concord Consortium
Seeing Math: Plop It
Plop It! lets you experiment with the concepts of mean, median, and mode (measures of center). You see the differences among them on a bar graph, as you add or remove blocks to an axis with a given range.
AAA Math
Aaa Math: Aaa Math Lessons
AAA Math's interactive tutorials and lessons assist students grades K-8 improve their understanding of a wide range of arithmetic topics. Students are provided with immediate feedback as they complete the "Learn," "Practice," and "Play"...
Government of Alberta
Learn Alberta: The Exponential Function
This interactive Java applet allows students to view numerous exponential functions by manipulating the constants in an exponential function.
PBS
Pbs Learning Media: Decreasing Water Levels
The CyberSquad creates a line graph to help tell the story of the decreasing water levels in Sensible Flats in this video segment from Cyberchase.
PBS
Pbs Learning Media: Keeping Track of the New York City Marathoners
In this video segment from Cyberchase, Bianca figures out a way to count the thousands of runners in the New York City Marathon.
Richland Community College
Richland Com. College: Graphing Systems of Inequalities
Thyis site offers problem solving systems and graphing systems of inequalities. Illustrations included.
National Council of Teachers of Mathematics
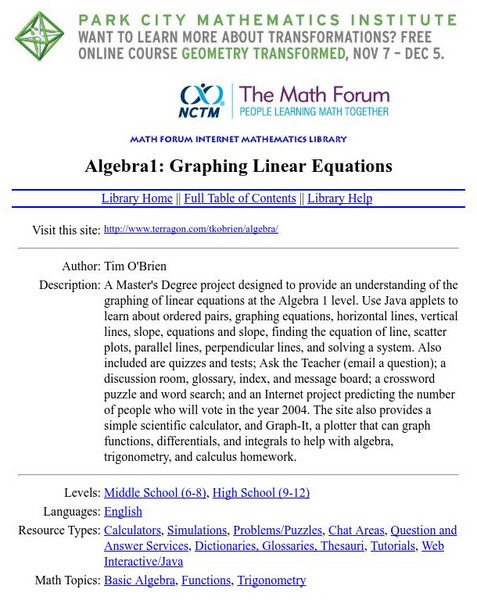
The Math Forum: Graphing Linear Equations
This site from The Math Forum provides chat areas, simulations, JAVAapplets, problems, answers, puzzles, quizzes and tutoring! Links are also provided for additional information.
University of Georgia
University of Georgia: Hyperbolas
A four-lesson tutorial on hyperbolas, the standard form for hyperbolic functions, and how to graph them. Includes a lesson quiz.


