Other
New Internationalist Magazine: Muslims: The Facts
Facts and statistical data of Muslim populations around the world. Includes geographical distribution of different groups and sectors.
The Franklin Institute
Frankin Institute Online: Group Graphing
This site from The Franklin Institute explores how to make a simple graph using a spreadsheet to portray survey data. It also gives a set of interesting sports-related web sites so that students can get statistical inforamtion.
United Nations
Unesco: Math Games (In Arabic)
This site offers games and lessons that teach basic math concepts such as area and volume, number patterns, time, etc. Games use familiar tasks such as shopping to reinforce math concepts. While the title of each page includes an English...
San Diego State University
San Diego State University: Allometric Modeling
This site shows how to use exponential graphs to model AIDS cases. Very detailed site.
Mangahigh
Mangahigh: Algebra: Recognize the Equations of Common Curves
Students recognize and know the sketches of quadratics, cubics and recipricols including the shape of positive and negative functions and the interpretation of their y-intercepts.
TeachEngineering
Teach Engineering: Issues Awareness
In this activity, students will conduct a survey to identify the environmental issues (in their community, their country and the world) for which people are concerned. They will tally and graph the results. Also, students will discuss...
Other
Algebra.com: Homework Solvers
This site offers both instruction and homework help in several algebraic topics, including topics within Pre-Algebra, Algebra I, and Algebra II.
Texas Education Agency
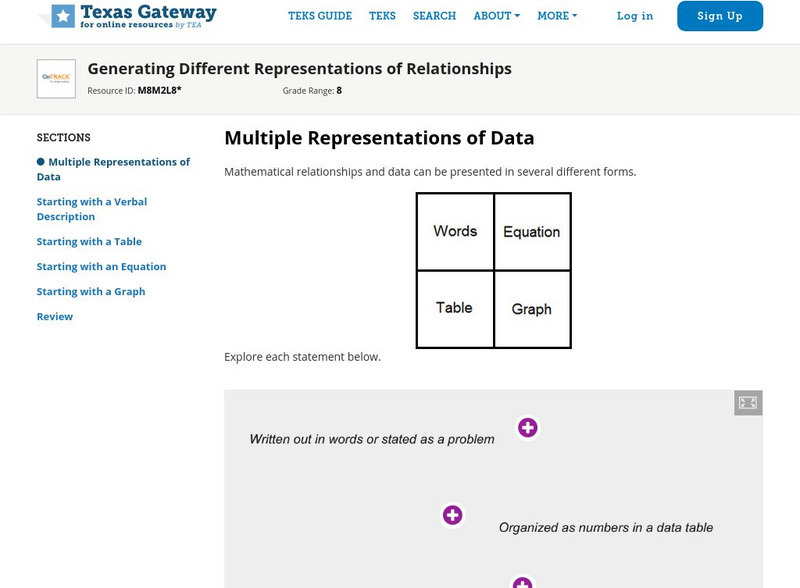
Texas Gateway: Generating Different Representations of Relationships
Given problems that include data, the student will generate different representations, such as a table, graph, equation, or verbal description.
Wyzant
Wyzant: Calculator Index
These WyzAnt online graphing utilities help you calculate just about anything in algebra, including solving linear and quadratic equations to factoring polynomials. This a great tool for checking homework.
Discovery Education
Discovery Education: Web Math: Graph a Line
WebMath offers a java applet that allows you to input the slope of a line and a point on the line and gives you the equation, in slope-intercept form, of the line with the given slope that passes through the point. It also includes a...
Discovery Education
Discovery Education: Web Math: Graph a Circle
WebMath offers a java applet that allows you to input information about a circle, in one of four forms, and gives you the graph of the circle.
Discovery Education
Discovery Education: Web Math: Graphing Hyperbolas
WebMath offers a java applet that allows you to input information about hyperbolas in one of eight forms and gives you the graph of the hyperbola.
CK-12 Foundation
Ck 12: Analysis: Applications of Parabolas
[Free Registration/Login may be required to access all resource tools.] Exploring the similarity of parabolas and their use in real world applications
CK-12 Foundation
Ck 12: Plix Series: Average Acceleration
[Free Registration/Login Required] Build the appropriate graph curve to illustrate an acceleration problem. After the activity, answer a challenge question to check for understanding.
Math Is Fun
Math Is Fun: Stem and Leaf Plots
Explains, with examples, what stem and leaf plots are. Includes a set of practice questions.
Utah Education Network
Uen: Chicken Pox Math
Students will engage in a shared reading of Itchy, Itchy Chicken Pox by Grace Maccarone, Arthur's Chicken Pox by Marc Brown, or Turkey Pox by Laurie Anderson. Students will discuss the text and then engage in several math-related tasks...
Utah Education Network
Uen: 1st Grade Act. 04: Chrysanthemum and Letter Tiles
In this lesson plan, students will engage in shared reading with the Kevin Henkes' book, Chrysanthemum. Then students will engage in a letter tiles activity that requires them to compare the length of their own names with the name...
Can Teach
Can Teach: Plot Four: Positive and Negative Numbers
Plotting points is usually an interesting activity for learners. Make it even more interesting and engaging using this game.
Teachnology
Teachnology: Spreadsheet Guide for Teachers
A Spreadsheet is a wonderful tool with applications well beyond simple calculations. This site provides a collection of lesson plans, tutorials and worksheets that help bring spreadsheets into the classroom.
Sophia Learning
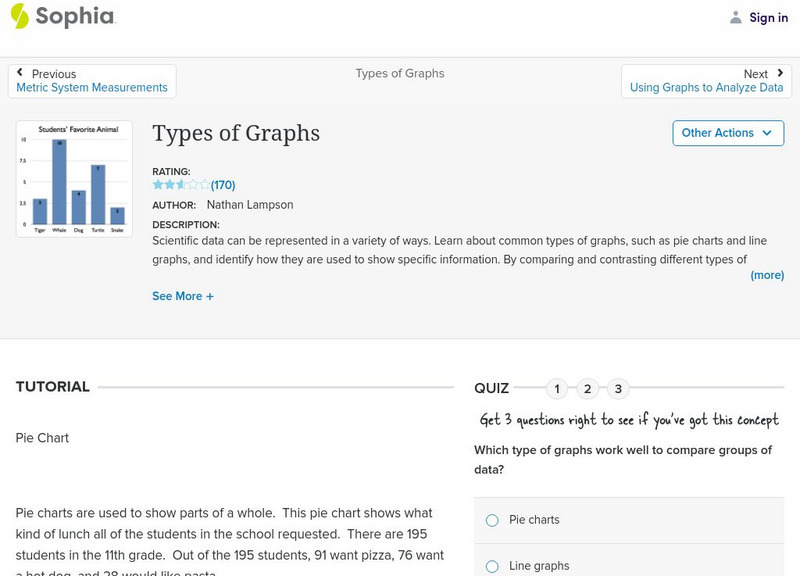
Sophia: Types of Graphs
This presentation allows the learner to visualize the different types of graphs used to display data in scientific investigations.
Paul Dawkins
Paul's Online Notes: Math Notes: Excluded Values in Rational Functions
A description and example of which values are excluded from the domain of a rational function.
National Council of Teachers of Mathematics
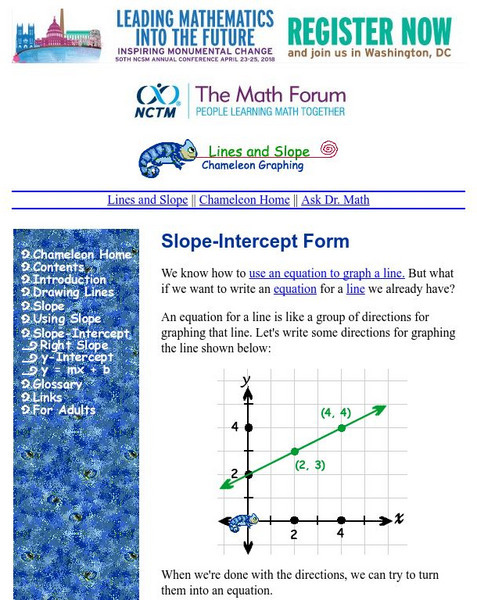
The Math Forum: Slope Intercept
Use this site to learn how to write an equation in slope-intercept form if you already have the graph of the line. Let Joan the Chameleon walk you through the process.
Other
Wpi: Exponential Decay and Effective Medicine Dosage
This site is an example of the use of exponential decay. The example involves the effectiveness of a medical dosage over time.


