Northeast Parallel Architectures Center, Syracuse University
Npac Reu Program: Graphing With Coordinates in the Plane
This site from the Northeast Parallel Architectures Center, Syracuse University provides a good five-part basic graphing instructor. Covers all the basics clearly. It is divided into links for easier navigation.
Other
Git: What Is the Slope Intercept Form of a Line?
Not only does this site show what the slope-intercept form is, but it helps you find the slope and the intercept of a line. There is also additional information on parallel lines, parametric form, and the distance between two points.
Rice University
Hyper Stat Online Statistics Textbook: Chapter 3: Describing Bivariate Data
This chapter of an online textbook begins with a description of scatterplots, then focuses on the Pearson Product Moment Correlation.
University of Vienna (Austria)
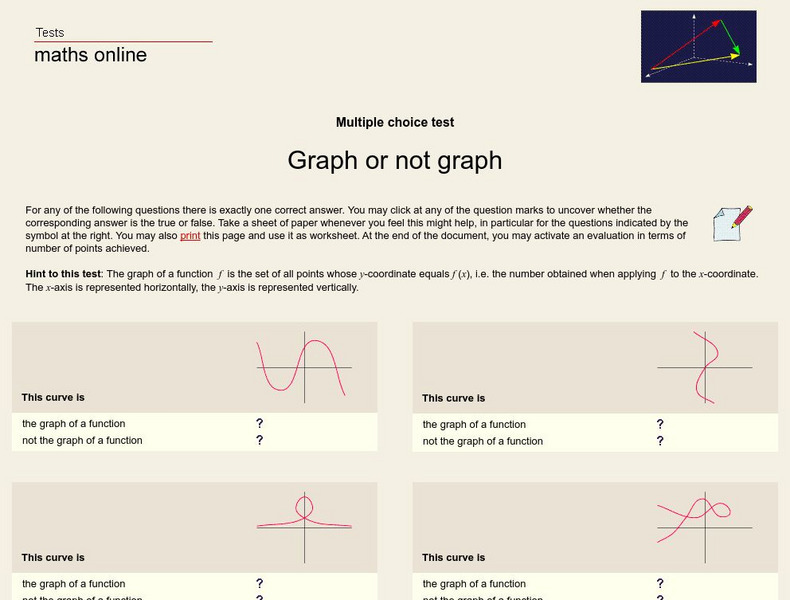
University of Vienna: Graph or Not Graph
Interactive quiz to determine whether each graph is representative of a function or not. Some graphs are discontinuous, some fail the vertical line test, and some actually are functions. After completion, the site gives a score to judge...
Purple Math
Purplemath: Algebra Resources
Purplemath contains about 40 different lessons on various algebra topics. The lessons are divided into five different sections: preliminary topics, beginning algebra, intermediate algebra, advanced algebra, and word problems. The lessons...
Physics Classroom
The Physics Classroom: 1 D Kinematics: Describing Motion Graphically [Pdf]
A collection of high-school level physics problems with an emphasis on kinematics where students practice describing motion graphically.
Knowledge Share
Super Kids: Word Search Puzzle Creator
Are you looking for creative ways improve spelling and vocabulary skills? Try using the printable hidden word puzzle program. You can select your own words, determine the size and difficulty level of the graph and print it out.
Physics Aviary
Physics Aviary: Quick Graphing/linearizing Program
This program was designed as a quick graphing program that students could use on a computer, tablet or smart phone when a more complex graphing program is not available. This program will let students plot up to 10 data points and then...
Physics Aviary
Physics Aviary: Graphing Motion Lab
This lab was designed to generate some data that students can use when learning about simple graphing motion. Students will track the motion of a row boat as it moves through a course and then they will create a graph of the data that...
Cool Math
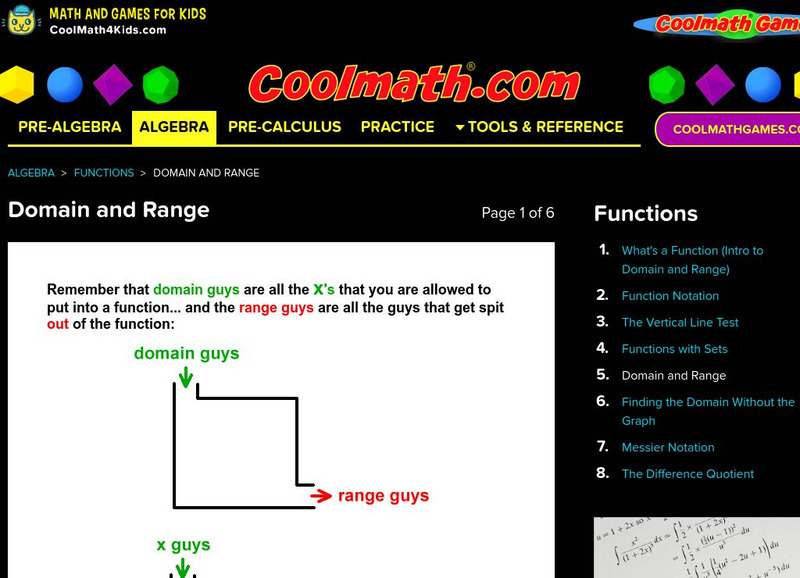
Coolmath: Functions Domain and Range
This algebra lesson explains to find the domain and range of a function by looking at the graph.
Khan Academy
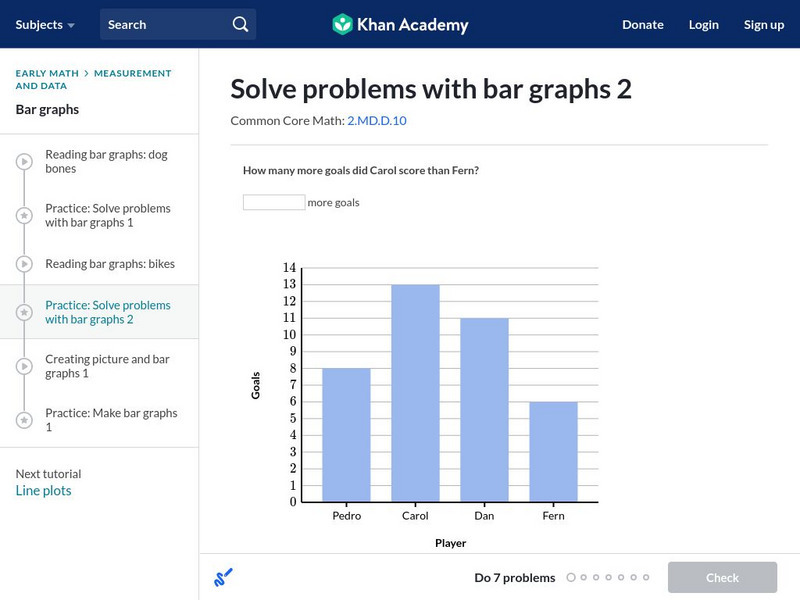
Khan Academy: Solving Problems With Bar Graphs 2
In this exercise, students practice solving problems with bar graphs. Students receive immediate feedback and have the opportunity to get hints, watch a tutorial video, and try questions repeatedly.
Khan Academy
Khan Academy: Solve Problems With Bar Graphs 2
Use bar graphs to solve addition and subtraction word problems. Students receive immediate feedback and have the opportunity to try questions repeatedly, watch a tutorial video, or receive hints.
National Institute of Standards and Technology (NIST)
Dictionary of Algorithms and Data Structures: Abstract Data Type
The DADS description of the dictionary abstract data type.
Illustrative Mathematics
Illustrative Mathematics: 6.sp4, 5c Puzzle Times
A performance task asking students to create a graph of provided information and then find the mean and the median of the data.
Illustrative Mathematics
Illustrative Mathematics: 6.sp Puppy Weights
A performance task asking learners to create a graph of provided information and then answer two questions about the information provided with that graph.
Concord Consortium
Concord Consortium: Quadratic Functions in Vertex Form
Given the equation of a quadratic function in vertex form, students learn to identify the vertex of a parabola from the equation, and then graph the parabola.
Concord Consortium
Concord Consortium: Solving Systems of Equations
Two linear equations, with two variables, are presented and students use graphs to solve the system of equations.
Concord Consortium
Concord Consortium: Inverses of Functions
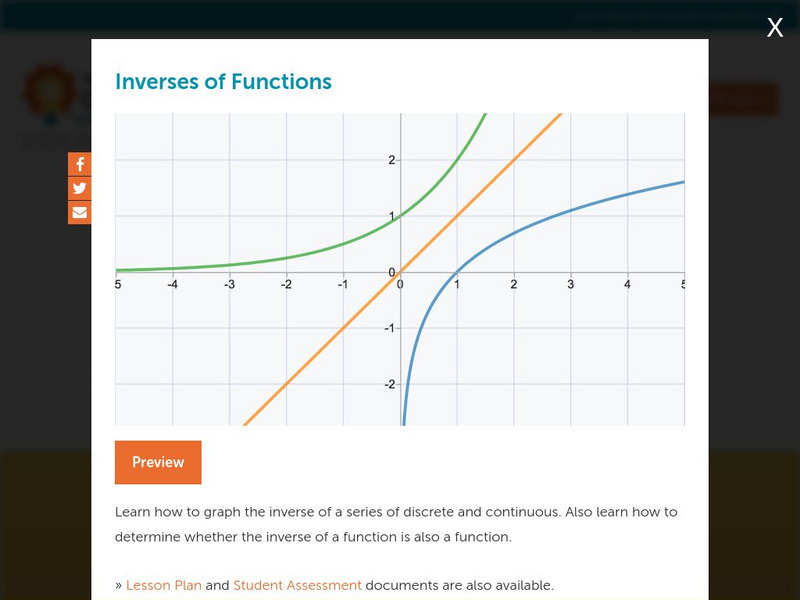
Learn how to graph the inverse of a series of discrete and continuous. Also learn how to determine whether the inverse of a function is also a function.
Concord Consortium
Concord Consortium: Exponential Decay
Learn about exponential decay in real-world situations. Problems involve the application of depreciation of an asset and radioactive decay. Learn to apply exponential decay equations and interpret graphs.
Concord Consortium
Concord Consortium: Transformations of Functions 2: Dilations
By the end of the module students will be able to identify a given function dilation, identify the way the graph will change and sketch a graph of the dilated function
Purple Math
Purplemath: Function Transformations
Generally, translation involves only moving the graph around. Squeezing or stretching a graph is more of a "transformation" of the graph. But these two topics are usually taught at the same time, and usually under the same name. Just be...
Purple Math
Purplemath: Graphing Overview: Straight Lines
This resource provides an overview of graphing for various types of functions, instruction on graphing straight lines and also, includes advice on common mistakes made by students.
Purple Math
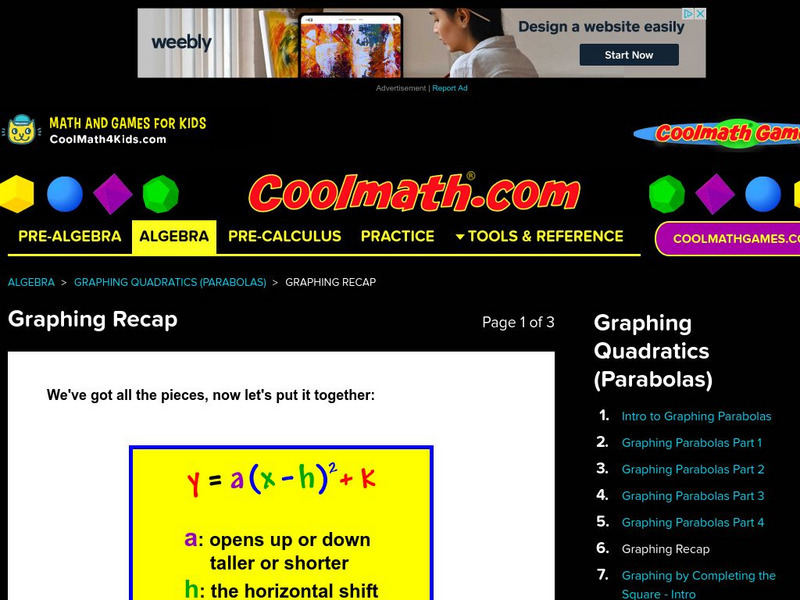
Purplemath: Graphing Quadratic Functions: Introduction
The most basic quadratic is y = x2. The general technique for graphing quadratics is the same as for graphing linear equations. The quadratics graph as curvy lines (called "parabolas"), rather than the straight lines generated by linear...


