ClassFlow
Class Flow: Grids 100 Square
[Free Registration/Login Required] The teacher will use this flipchart to review numbers with 3rd grade students.
ClassFlow
Class Flow: Kindergarten Graphing
[Free Registration/Login Required] This math flipchart teaches kindergarteners how to place an object/picture on graph and how to interpret the results.
ClassFlow
Class Flow: Let's Graph It!
[Free Registration/Login Required] This flipchart has a week of mini lessons where students create bar graphs and pictographs. Students will collect data using tally marks and analyze graphs with discussion questions. Activotes are used...
ClassFlow
Class Flow: Linear Equations
[Free Registration/Login Required] Connects what we have learned about slope as a ratio to linear equations. We had previously used the term rate of change, but can now connect it to the idea of slope. There are information pages and...
ClassFlow
Class Flow: Linear Equations Substitution
[Free Registration/Login Required] In this Flipchart, students are introduced to linear equations, substitutions, and graphing linear equations on a coordinate grid system.
ClassFlow
Class Flow: Linear Models
[Free Registration/Login Required] Students will learn the different forms of an equation of a line and will find the equations of a line in all three forms- point-slope form, slope-intercept form, and the general form (Ax+By=C).
ClassFlow
Class Flow: Math Templates
[Free Registration/Login Required] A group of math templates including a blank calendar, a hundreds board you can use for number patterns (only colors the square you click on), an invisible numbers 100s chart, a blank 10 x10 graph/grid,...
Can Teach
Can Teach: Math Centers
This page offers a variety of math center ideas for general math and geometry. Instructions on setting up the center are not provided for most ideas, however, those lacking instructions are pretty self-evident.
Math Is Fun
Math Is Fun: Make an Alien Mask Using Ordered Pairs
This website gives you the ordered pairs you need to make an Alien mask using graph paper.
Math Is Fun
Math Is Fun: Make a Dinosaur Using Ordered Pairs
This website gives you the ordered pairs you need to make a Diplodocus dinosaur using graph paper.
Math Is Fun
Math Is Fun: Make a T Rex Dinosaur Using Ordered Pairs
This math tutorial on ordered pairs has students make a T-Rex dinosaur using graph paper.
That Quiz
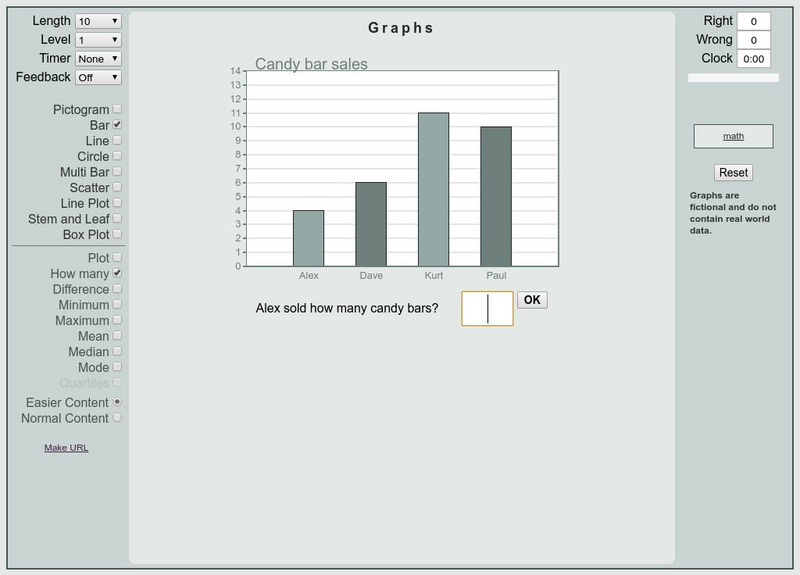
That Quiz: Graficas
This is an interactive practice to review bar graphs, circle graph, scatter plot, etc. Test are timed and keep track of right and wrong answers. Different levels of difficulties are provided.
University of Illinois
University of Illinois Urbana Champaign: Venn Diagrams
An introduction to Venn Diagrams and their use. Gives examples of diagrams exhibiting relationships between two sets.
Other
Nlreg: Piecewise Function With Two Segments
Contains an example of graphing a piecewise function in a Texas Instruments calculator.
Richland Community College
Richland Community College: Graphs of Functions
This site from the Richland Community College provides graphs of Functions offers loose definitions of many terms relative to the graphing of functions.
Oswego City School District
Regents Exam Prep Center: Graphing Parabolas
Works through an example to show how to graph a parabola. Also shows what a positive and negative axis of symmetry looks like.
Purple Math
Purplemath: Using Slope and Y Intercept to Graph Lines
Demonstrates, step-by-step and with illustrations, how to use slope and the y-intercept to graph straight lines.
Purple Math
Purplemath: Factoring Polynomials: How To
Demonstrates the steps involved in factoring a general polynomial, including using the Rational Roots Test and synthetic division. Shows how to "cheat" with a graphing calculator.
Purple Math
Purplemath: Solving Polynomials: How To
Demonstrates the steps involved in solving a general polynomial, including how to use the Rational Roots Test and synthetic division. Points out when using a graphing calculator can be very helpful.
University of Illinois
University of Illinois: Rollin' Rollin' Rollin'
This resource is the beginning of a series of pages that demonstrates the diffference between the mean and median of a group of numbers. Uses bar graphs to display the data.
Other
Eduteka: Matematica Interactiva
Topics covered in this site are: concepts of numbers, geometry, algebra and statistics. This site has lesson plans, interactive activities and discussions.


