Cuemath
Cuemath: Outlier
A comprehensive guide for exploring the topic of outliers with definitions, what is an outlier, how to find outliers using the turkey method and the interquartile range, solved examples, and interactive questions.
Scholastic
Scholastic: Cultivating Data
Middle schoolers will understand key concepts of data analysis and their graphic representations. Students will construct and interpret data tables, line plots, box-and-whisker plots and stem-and-leaf plots, scatterplots with line of...
Shodor Education Foundation
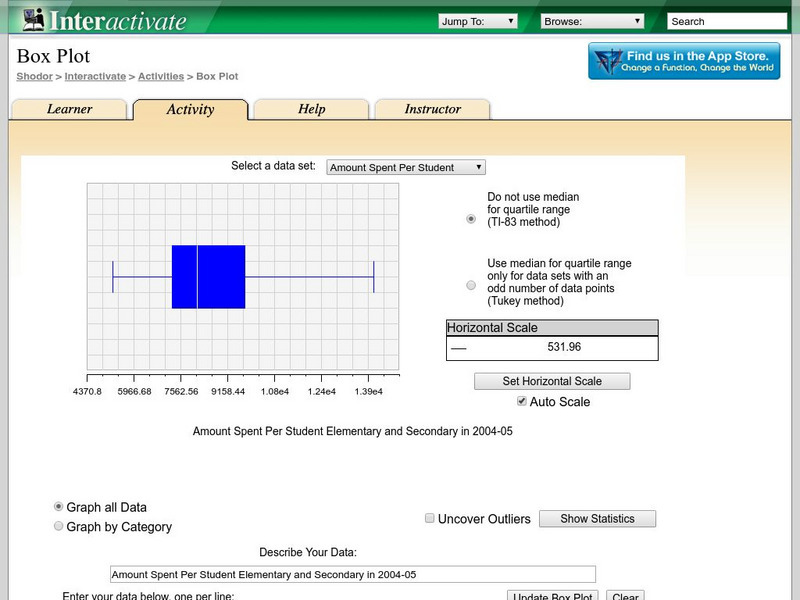
Shodor Interactivate: Box Plot
Students learn about box-and-whisker plots. The interactive box plot allows the user to explore maximum, minimum, median, upper quartile, lower quartile, and outliers.
Texas Instruments
Texas Instruments: Measures of Central Tendency Activity: Height of the Class
The purpose of this lesson is to have students create a box and whiskers plot from collecting class data of each person's height.
Texas Instruments
Texas Instruments: Car Sales
In this activity, students will create a box and whisker plot using a list. The list will be sent using TI-Navigator and contains the number of car sales since 1970. They will determine the values in the box plot and answer some...
Texas Instruments
Texas Instruments: Math Today for Ti Navigator System Super Ticket Sales
Students will create two box-and-whisker plots of the data in the USA TODAY Snapshot, "Super ticket sales". Students will calculate central tendencies for both sets of data. Students will compare the two sets of data by analyzing the...
Texas Instruments
Texas Instruments: How Far to Your Birthplace
Examine one-variable data analysis through the creation and exploration of a birth place data set. Graphing calculators are used to analyze the data through mean, median, mode, maximum, minimum, stem-and-leaf plots and box-and-whisker...
Texas Instruments
Texas Instruments: Measures of Central Tendency
Mean, median, and mode are measures of central tendency in data analysis. Each can be used to identify central tendency. Box-and-whiskers plots are a visual representation of collected data involving medians.
Texas Instruments
Texas Instruments: Now You See It, Now You Don't
In this activity, students study the relationship between age and near point accommodation (NPA). They predict a person's age using NPA distance values. They use exponential regression, create box-and-whisker plots and histograms.
Texas Instruments
Texas Instruments: Mc Dougal Littell Algebra 1: Box and Whisker Plots
Students will make a box-and-whisker plot and list the first, second, and third quartiles.
Texas Instruments
Texas Instruments: Math Today Super Ticket Sales
Students will create two box and whisker plots of the data in the USA TODAY Snapshot. They will calculate central tendencies for both sets of data and compare the two sets of data by analyzing the differences in the box and whisker plots.
Texas Instruments
Texas Instruments: How Many States Have You Visited?
This is a beginner activity for students Using the TI-84. Students will collect data from the class and create a Box & Whisker plot based on how many States students have visited. This is easy for the teacher to learn, and steps are...
University of Georgia
University of Georgia: Inter Math: Box and Whisker Plot
Description of box-and-whisker plots and their uses, along with a visual representation. There are links to related terms, everyday examples, more information, and the interactive checkpoint involving box and whisker plots located in the...
National Council of Teachers of Mathematics
Nctm: Illuminations: Mean and Median
This applet allows the user to investigate the mean, median, and box-and-whisker plot for a set of data that they create.
National Council of Teachers of Mathematics
Nctm: Illuminations: State Names
Students use multiple representations to display how many times the letters of the alphabet is used in a state name. Concepts explored: stem and leaf, box and whisker plots, histograms.
Quia
Ixl Learning: Interquartile Range
Brush up on your math skills relating to interquartile range then try some practice problems to test your understanding.
National Council of Teachers of Mathematics
Nctm: Illuminations: Mean and Median Box and Whisker Plotter
A computer applet that will draw any box and whisker plot with student's data input.
Varsity Tutors
Varsity Tutors: Hotmath: Algebra Review: Box and Whisker Plots
Find a quick, concise explanation of a Box-and-Whisker Plot. An example is given and clearly explained.
Math Aids
Math Aids: Graph Worksheets
Great resource to practice and strengthen math skills pertaining to graphs. Math worksheets are printable, may be customized, and include answer keys.


