US Department of Education
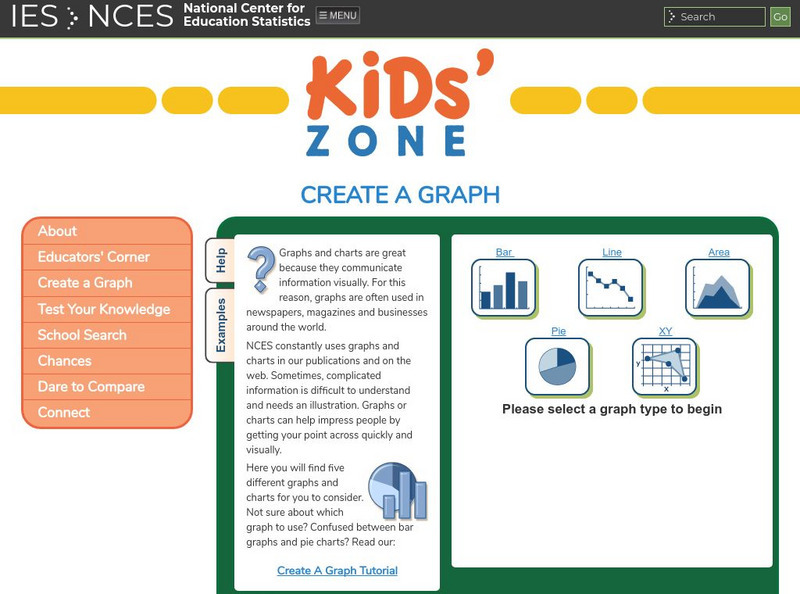
Nces Kids: Creating an Area Graph
This is where you will find step by step directions explaining how to create an area graph. Complete each step and click on the next tab. Directions are simple and clear.
The Franklin Institute
Frankin Institute Online: Group Graphing
This site from The Franklin Institute explores how to make a simple graph using a spreadsheet to portray survey data. It also gives a set of interesting sports-related web sites so that students can get statistical inforamtion.
National Council of Teachers of Mathematics
The Math Forum: Nctm: Ask Dr. Math: Stem and Leaf and Scatter Plots
This site is a question/response page which focuses on stem-and-leaf representation and how to construct scatter plots. Dr. Math works through an example and gives commentary notes. Site also contains links for more help.
US Department of Education
Nces Kids: Create an Xy Graph
This is where you can find a step by step explanation of how to create an XY graph. When you finish each step just click the next tab and you will find the next set of instructions.
National Council of Teachers of Mathematics
The Math Forum: Urban Systemic Initiative/oceans of Data
This site includes questions related to reading and understanding graphs. There are links on this site to lesson plans, benchmarks, and other webpages all of which mostly center about probability and statistics.


