McGraw Hill
Glencoe: Self Check Quizzes 2 Using Bar Graphs and Histograms
Use Glencoe's Math Course 2 randomly generated self-checking quiz to test your knowledge of Bar Graphs and Histograms. Each question has a "Hint" link to help. Choose the correct answer for each problem. At the bottom of the page click...
McGraw Hill
Glencoe: Self Check Quizzes 1 Using Bar and Line Graphs
Use Glencoe's randomly generated self-checking quiz to test your knowledge of using bar and line graphs. Each question has a "Hint" link to help. Choose the correct answer for each problem. At the bottom of the page click the "Check It"...
Texas Education Agency
Texas Gateway: Selecting and Using Representations for Collected Data
[Accessible by TX Educators. Free Registration/Login Required] Given a variety of data (including line plots, line graphs, stem and leaf plots, circle graphs, bar graphs, box and whisker plots, histograms, and Venn diagrams), the student...
McGraw Hill
Glencoe: Self Check Quizzes 1 Using Graphs to Make Predictions
Use Glencoe's randomly generated self-checking quiz to test your ability to use graphs to make predictions. Each question has a "Hint" link to help. Choose the correct answer for each problem. At the bottom of the page click the "Check...
McGraw Hill
Glencoe: Self Check Quizzes 1 Analyzing Graphs
Use Glencoe's randomly generated self-checking quiz to test your knowledge of how to analyze graphs. Each question has a "Hint" link to help. Choose the correct answer for each problem. At the bottom of the page click the "Check It"...
Other
Online Statistics Education: Graphing Distributions [Pdf]
This is the second chapter of a statistics e-text developed collaboratively by Rice University, University of Houston Clear Lake, and Tufts University. It looks at many different types of data displays and the advantages and...
Oswego City School District
Regents Exam Prep Center: Displaying Data
Use this lesson, practice exercise, and teacher resource in planning instruction on displaying data. In the lessons, you'll find definitions and examples of ways to collect and organize data, quartiles, and box-and-whisker plots, as well...
Government of Alberta
Learn Alberta: Math Interactives: Exploring Election Data
Using actual Alberta provincial election results, students have the opportunity to interpret election data using a variety of graph types. Pictographs, line graphs, bar graphs, circle graphs, and data tables are covered in this...
Government of Alberta
Learn Alberta: Math Interactives: Exploring Data Display and Graphs
This multimedia Learn Alberta math resource focuses on graphing data. In the video portion, students will see how math is involved in the display of merchandise in stores. The accompanying interactive component provides an exploration...
Khan Academy
Khan Academy: Unit: Modeling Data Distributions
A complete unit with tutorials, text, and practice over modeling data distributions.
Other
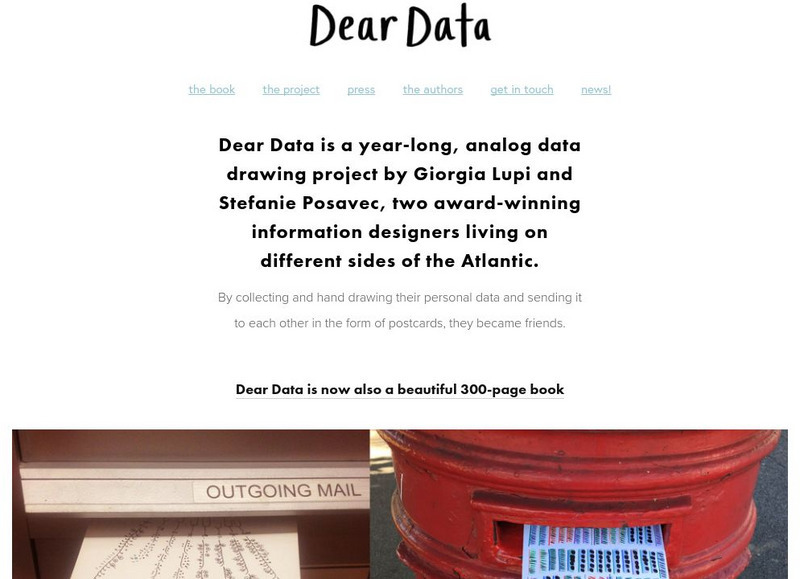
Dear Data
Dear Data is a year-long, analog data drawing project by Giorgia Lupi and Stefanie Posavec, two award-winning information designers living on different sides of the Atlantic. By collecting and hand drawing their personal data and sending...
TED Talks
Ted: Ted Ed: Hans Rosling Shows the Best Stats You've Ever Seen
Explore collected data in regards to life expectancies, family size, and finances through out the world and the various ways the data has been displayed.
Texas Instruments
Texas Instruments: Going, Going, Gone!
This activity gives students an opportunity to select and create the most appropriate graph to represent a given data set.
Palomar Community College District
Palomar College: Behavioral Science Statistics: Cumulative Percent Polygon
A step-by-step worked problem demonstrating how to take a set of data and produce a cumulative percent polygon. Hints are provided along the way, and the final graph is shown for the user to check.
University of Texas at Austin
Mathematics Teks Toolkit: The Sounds of Music
In this lesson, learners collect data, graph it, then determine the period and frequency of the sound waves made by a guitar.
CK-12 Foundation
Ck 12: Statistics: Bar Graphs Grade 7
[Free Registration/Login may be required to access all resource tools.] Make a bar graph to display given data.
CK-12 Foundation
Ck 12: Statistics: Bar Graphs Grade 8
[Free Registration/Login may be required to access all resource tools.] Students will interpret data to understand given bar graphs.
CK-12 Foundation
Ck 12: Statistics: Circle Graphs to Display Data Grades 6 7
[Free Registration/Login may be required to access all resource tools.] Here you'll display data by using a circle graph.
CK-12 Foundation
Ck 12: Statistics: Circle Graphs to Display Data Grade 7
[Free Registration/Login may be required to access all resource tools.] Make circle graphs by using given data.
CK-12 Foundation
Ck 12: Frequency Tables to Organize and Display Data Grades 6 7
[Free Registration/Login may be required to access all resource tools.] Create a frequency table from given data.
CK-12 Foundation
Ck 12: Frequency Tables to Organize and Display Data Grade 7
[Free Registration/Login may be required to access all resource tools.] Make a frequency table to organize and display data.
Khan Academy
Khan Academy: Comparing Data Displays
Practice interpreting and comparing dot plots, histograms, and box plots. Students receive immediate feedback and have the opportunity to try questions repeatedly, watch a video or receive hints.
Math Is Fun
Math Is Fun: Data Graphs
Create and customize a bar graph, line graph, or pie chart based on a set of data and print it out.
CK-12 Foundation
Ck 12: Statistics: Data Display Choices Grades 6 7
[Free Registration/Login may be required to access all resource tools.] Create surveys and display data using different types of graphs.







![Online Statistics Education: Graphing Distributions [Pdf] eBook Online Statistics Education: Graphing Distributions [Pdf] eBook](https://d15y2dacu3jp90.cloudfront.net/images/attachment_defaults/resource/large/FPO-knovation.png)


