CK-12 Foundation
Ck 12: Statistics: Data Display Choices Grade 7
[Free Registration/Login may be required to access all resource tools.] Associate given conclusions about a set of data given different displays of data.
CK-12 Foundation
Ck 12: Statistics: Bar Graphs Grades 9 10
[Free Registration/Login may be required to access all resource tools.] Make a bar graph to display given data.
Texas Instruments
Texas Instruments: Describing One Variable Data
Students sort data and display it graphically using various plots. They also get familiarized with statistical concepts like measures of spread and central tendency.
CK-12 Foundation
Ck 12: Types of Data Representation: Graphic Displays of Data
[Free Registration/Login may be required to access all resource tools.] Here you will explore displays of data using bar charts, histograms, pie charts and boxplots, and learn about the differences and similarities between them and how...
CK-12 Foundation
Ck 12: Statistics: Basic Graph Types
[Free Registration/Login may be required to access all resource tools.] Organize distributions of data by using a number of different methods.
CK-12 Foundation
Ck 12: Graphic Displays of Data
[Free Registration/Login may be required to access all resource tools.] In this lesson, students compare different types of graphic displays to understand how to choose the best method of displaying their data, and they learn the...
Other
Kindergarten lessons.com: Graphing Activities
Graphing activities for preschool and kindergarten include collecting data and organizing it in a variety of ways. There are lots of fun things to do in this area of math and the activities integrate well with science and literacy...
Khan Academy
Khan Academy: Picture Graphs (Pictographs) Review
Picture graphs are a fun way to display data. This article reviews how to create and read picture graphs (also called pictographs).
Better Lesson
Better Lesson: Class Surveys and Graphs
Students love graphing data that they "own". In this plan, the class will select a type of graph and create it using a class survey frequency table. Included in this lesson are videos of the class engaged in the lesson and samples of...
Shodor Education Foundation
Shodor Interactivate: Plop It!
PlopIt allows users to build dot plots of data using the mouse. View how the mean, median, and mode change as entries are added to the plot.
Other
Nearpod: Displaying Data: Dot Plots
In this lesson, students will learn how to create and intrepret dot plots.
E-learning for Kids
E Learning for Kids: Math: Wizards: Graphs
Join the Magic Wandia Games and learn all about graphs!
Other
Northern Michigan University: Stem and Leaf Plot
Site discusses how to use stem-and-leaf plots with an example and the steps listed for easy reading.
ClassFlow
Class Flow: Graphs
[Free Registration/Login Required] This flipchart is a quick review of line, bar, and circle graphs.
That Quiz
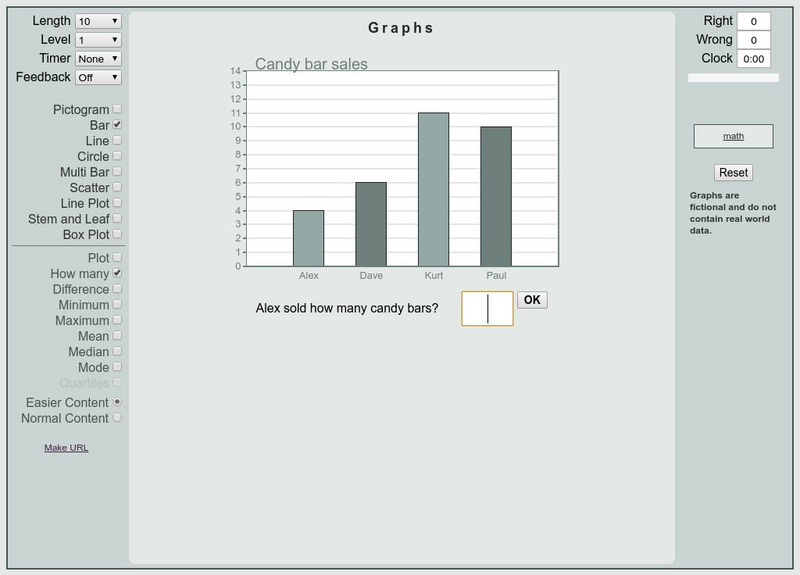
That Quiz: Graficas
This is an interactive practice to review bar graphs, circle graph, scatter plot, etc. Test are timed and keep track of right and wrong answers. Different levels of difficulties are provided.
Richland Community College
Richland Community College: Stats Graphs Defined
Richland Community College provides a glossary of many terms that are needed in order to understand statistics graphs and charts. Each of the types of charts is quickly explained in terms of what it is most effective in displaying.


