Khan Academy
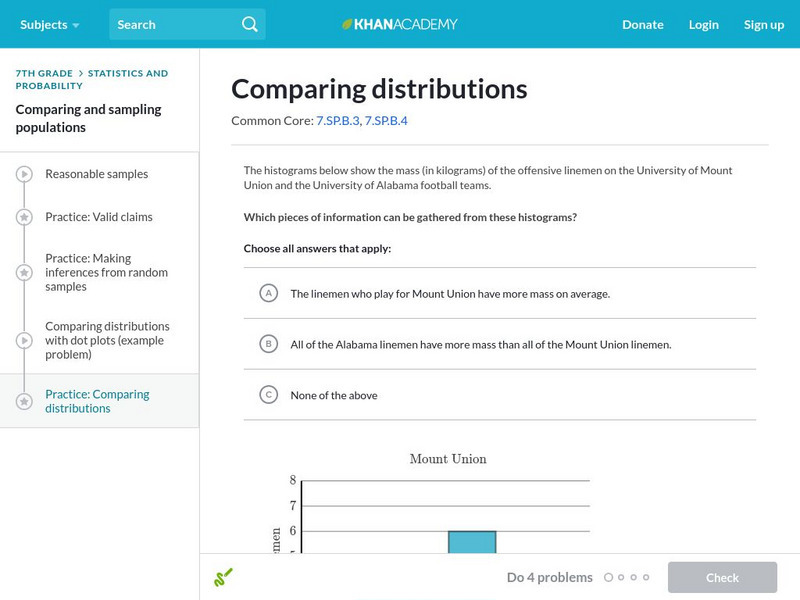
Khan Academy: Comparing Distributions
Practice comparing distributions of data in different forms of graphical representation.
Fundación Cientec
Ecologia Y Matematica Entretejidas
Four lesson plans in Spanish for elementary math and science class. Young scholars are required to classify animals and make observations. Offers explanations and detail of the lessons and methodology it is based in.
University of Cambridge
University of Cambridge: Maths and Sports: Olympic Records
Can you work out which Olympics athletics event each anonymised graph of Olympic records data represents? This activity, aimed at Key Stage 3 (age 11-14), gives students the opportunity to make sense of graphical data and challenges them...
Illustrative Mathematics
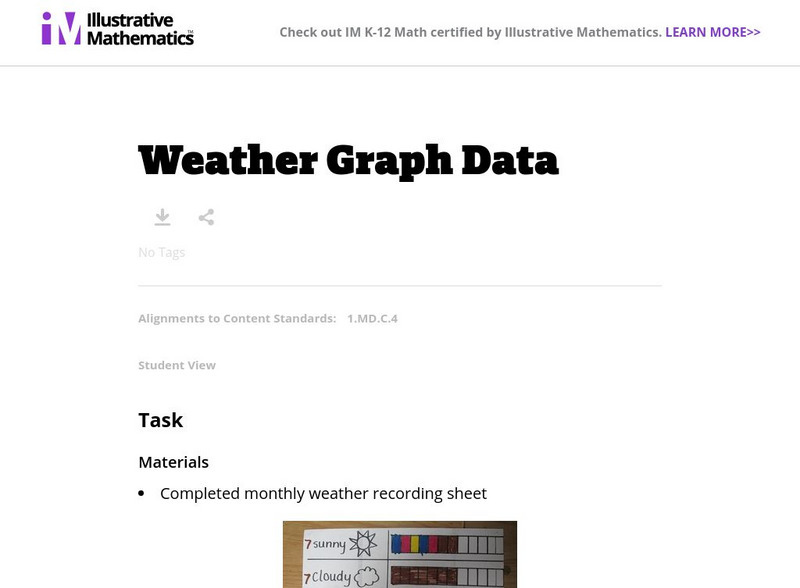
Illustrative Mathematics: Weather Graph Data
The purpose of this task is for students to represent and interpret weather data, as well as answer questions about the data they have recorded. Student worksheets and recording sheet are included.
University of Georgia
University of Georgia: Inter Math: Types of Data
This site has a concise definition of "Data," plus examples of data types and collection methods.
Alabama Learning Exchange
Alex: Ice Cream Sundae Survey
Students quickly realize the importance of learning how to read and find information in charts, graphs, and tables compared to finding the same information written in a paragraph. This is a fun, high energy lesson plan!This lesson plan...
Other
Career Foundry: How to Conduct User Experience Research Like a Professional
Find out about user experience research using these data collection tips.
Better Lesson
Better Lesson: Statistically Speaking....
Determining a good statistical question is the foundation of statistics.
PBS
Pbs Kids: Curious George: Hat Grab
This Curious George game teaches children data analysis and graphing. Grab hats as people pass by so that George can graph the collected hats. Then answer a question about the hats!
Better Lesson
Better Lesson: What Is Your Favorite Pet?
SWBAT create a bar graph to match a data set. SWBAT analyze the graph to find 3 pieces of information the graph shows them.
Better Lesson
Better Lesson: What Is Your Favorite Little Bear Story?
SWBAT create a bar graph to match a data set. SWBAT analyze the graph for 3 pieces of information.
Better Lesson
Better Lesson: What Playground Toy Should the Principal Buy for Us
SWBAT use a graph as evidence in a persuasive letter. SWBAT evaluate statements to determine which statement is true, citing evidence in the graph.
Better Lesson
Better Lesson: What Is Your Favorite Snack?
SWBAT use graphs to analyze whether a statement is true or false. SWBAT use graphs as evidence for a persuasive letter.
Better Lesson
Better Lesson: Heading Back
7, 8, 9, 10, 11, 12, Now Stop and Turn It Around! That is the idea today as the students are introduced to the idea of counting back to 1.
Better Lesson
Better Lesson: Using Table Data: Time to the 1/2 Hour
My students have learned how to read and write time. Now I want them to see how important time is for us to organize our lives. I want them to use data charts for schedules and be able to analyze the information.
Better Lesson
Better Lesson: Making a Table
First graders get a chance to use tables when breaking a total quantity into its component parts.
Better Lesson
Better Lesson: Would You Rather Be a Kid or a Grown Up?
Would you rather be a kid or a grown up? This question interests students and engages them in an interesting graphing exercise focused on how many total data points there are in a graph.
Better Lesson
Better Lesson: Survey Skills: Assessment
Today we become Gallup Poll central as students take a set of collected data and create a visual representation using the skills that have been taught over the past few lessons.
Better Lesson
Better Lesson: Our Own Surveys
Operation Independence! Students will now take what they have learned from previous data lessons and put it into action. The students will work in pairs of two to decide on a survey question and then collects classmates' responses to...
Better Lesson
Better Lesson: Unit Assessment
Survey says? That is the question today, as students work on three different tasks to assess the how they are doing with the skills from the current unit.
Better Lesson
Better Lesson: Terry's Taco Shack: What Does "How Many More" Mean?
Second graders oftentimes struggle with comparison problems since there is no "action" in the problem (i.e.: nothing is getting taken away or added). In this lesson, 2nd graders practice strategies for solving comparison problems.
Better Lesson
Better Lesson: Graphing Using a Frequency Table
Multiple graphs can represent the same data set and make the information easier to understand.
Better Lesson
Better Lesson: Reading Tables: What Breakfast Food Is Your Favorite?
In this lesson, 2nd graders will understand that tables help us organize information clearly.
Math Slice
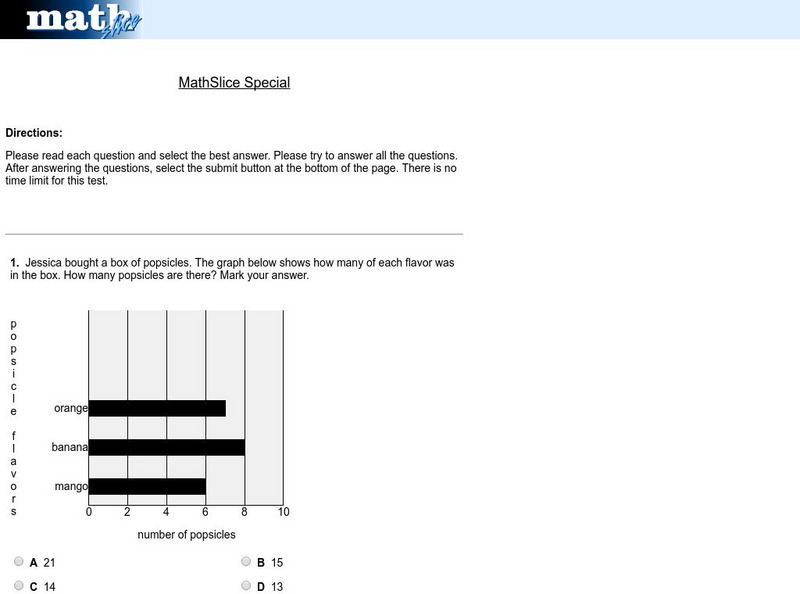
Math Slice: Chart Slice Special Test
A ten question test assessing data collection and analysis skills with bar graphs. Assessment is scored online. An excellent tool for assessment.


