Center for Innovation in Engineering and Science Education, Stevens Institute of Technology
Ciese Collaborative Projects: Down the Drain: How Much Water Do You Use?
How much water do you use everyday? Find out in this engaging investigation, where you compare your water usage with your classmates and other people around the world. An exploration filled with lots of math and science that students are...
Cuemath
Cuemath: Mean, Median and Mode
A comprehensive guide for learning all about mean, median, and mode with definitions, the relation between them, solved examples, and practice questions.
Cuemath
Cuemath: Measures of Central Tendency
A comprehensive guide for learning all about measures of central tendency with definitions of mean, median, and mode, solved examples, and practice questions.
Texas Instruments
Texas Instruments: An Average Lunch?
Students explore the meaning of the average (mean) value for a set of data.
Texas Instruments
Texas Instruments: Parts Is Parts
Students find a sample of a given size with a given mean. In this activity, students show one way 100 families can have a mean of 2.58 children and understand the meaning of the term "average".
Texas Instruments
Texas Instruments: Fractions and Skittles
Students will predict how many of each color will be in one pack of Skittles before they open the package. Once they open the package, they will determine how close their predictions are to the actual amount. Students then will come up...
Texas Instruments
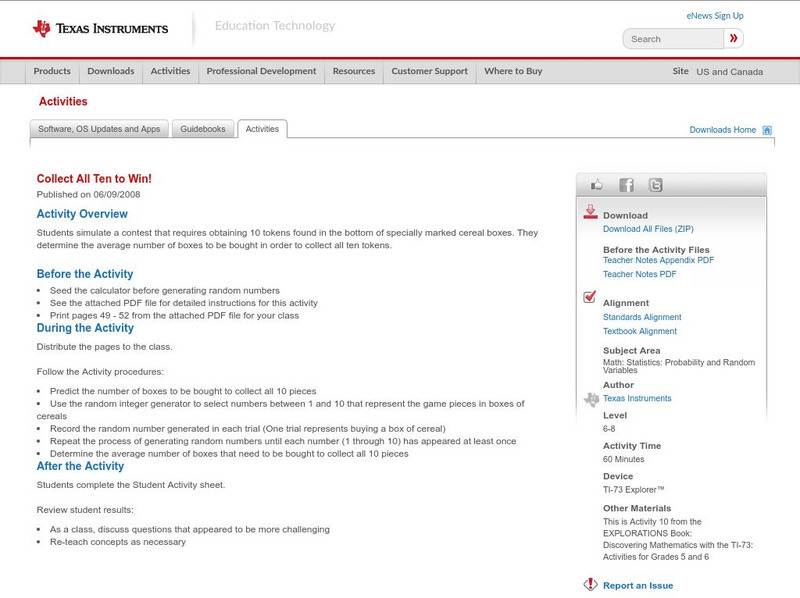
Texas Instruments: Collect All Ten to Win!
Students simulate a contest that requires obtaining 10 tokens found in the bottom of specially marked cereal boxes. They determine the average number of boxes to be bought in order to collect all ten tokens.
The Math League
The Math League: Ratio and Proportion
This tutorial provides definitions and examples of ratios and proportions and features comparing ratios and converting rates.
Beacon Learning Center
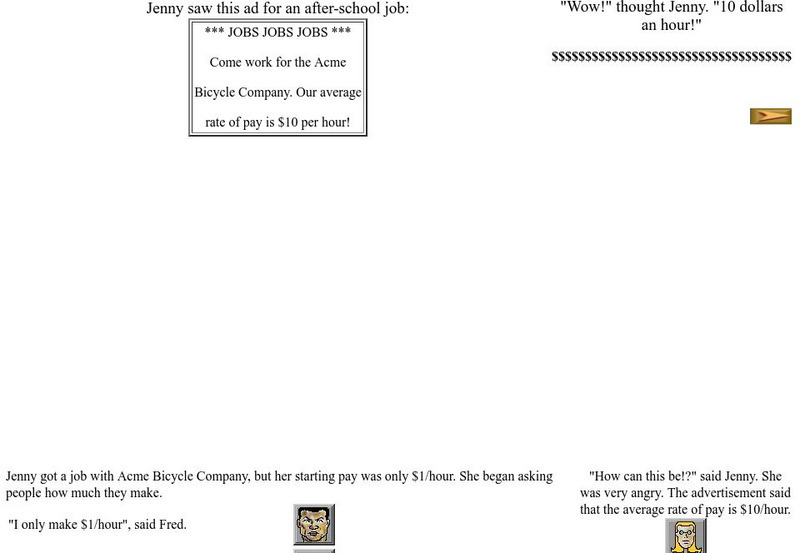
Beacon Learning Center: Bicycles a La Mode
This lesson explores how the mode can be used to analyze data. Learning exercises are provided for students to practice the skill.
Ministry of Education, Sports & Culture (Samoa) Government
Mesc: Samoa School Net: Mean, Median, Mode
A 2-part learning module on mean, median, and mode. Explains their definitions and discusses how to choose which term to best describe your data. Includes many well-illustrated examples. (There are a few typos, and money amounts are in...
Sophia Learning
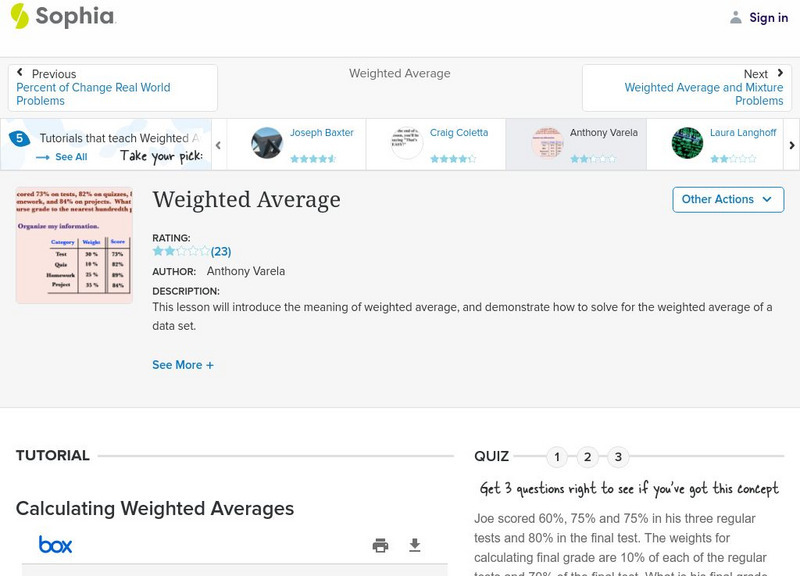
Sophia: Weighted Average
This lesson will introduce the meaning of weighted average, and demonstrate how to solve for the weighted average of a data set. Students can look at a presentation and then take an online quiz.
Sophia Learning
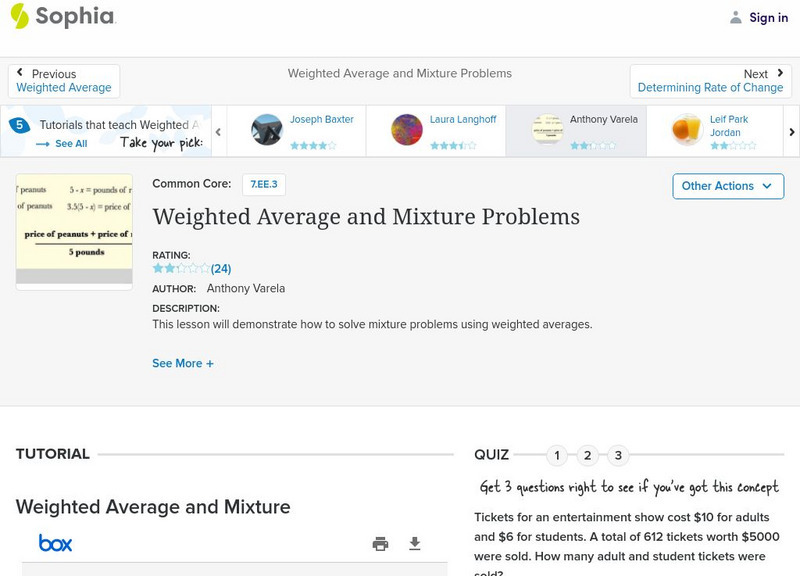
Sophia: Weighted Average and Mixture Problems
This lesson will demonstrate how to solve mixture problems using weighted averages. Students can explore a PowerPoint presentation and then take an online quiz.
Sophia Learning
Sophia: Weighted Average and Uniform Motion Problems
This lesson will demonstrate how to solve uniform motions problems using weighted averages. Student can watch a presentation and then take an online quiz.
Mangahigh
Mangahigh: Data: Find the Mean
Students learn about the concept of mean by exploring a tutorial. They can then test their knowledge by taking a ten question assessment that increases in difficulty as they correctly answer questions.
Mangahigh
Mangahigh: Data: Moving Averages
Students watch an online tutorial on the concept of moving averages. After watching, students test their knowledge by attempting ten practice problems that increase or decrease in difficulty based on their answers.
Mangahigh
Mangahigh: Data: Calculate the Mode
Students learn about the concept of mode by exploring a tutorial. They can then test their knowledge by taking a ten question assessment that increases in difficulty as they correctly answer questions.
Mangahigh
Mangahigh: Data: Calculate the Median
Students learn about the concept of median by exploring a tutorial. They can then test their knowledge by taking a ten question assessment that increases in difficulty as they correctly answer questions.
CK-12 Foundation
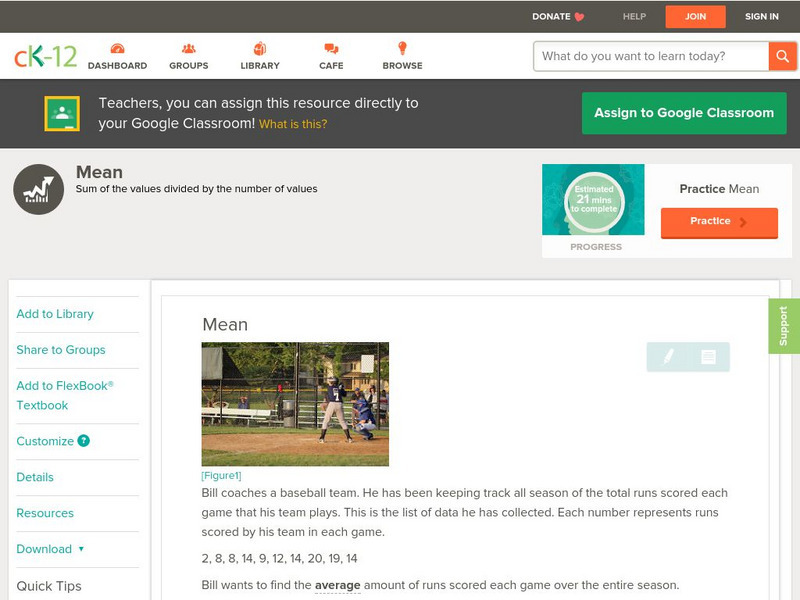
Ck 12: Statistics: Mean Grade 6
[Free Registration/Login may be required to access all resource tools.] Determine the mean, or average, in a given set of data.
CK-12 Foundation
Ck 12: Statistics: Ungrouped Data to Find the Mean
[Free Registration/Login may be required to access all resource tools.] Covers frequency distribution tables with ungrouped data.
CK-12 Foundation
Ck 12: Analysis: Instantaneous Rates of Change
[Free Registration/Login may be required to access all resource tools.] In this lesson students learn the difference between average rate of change and instantaneous rate of change. Students examine guided notes, review guided practice,...
CK-12 Foundation
Ck 12: Statistics: Median Grades 9 10
[Free Registration/Login may be required to access all resource tools.] Find the median of a set of data.
BBC
Bbc: Bitesize Revision: Data Handling: Mean
Need the basics on how to find a mean? Interactive examples are available that help you find the mean using data from a frequency table. You can also enter your own data and find the mean. You will find plenty of guided practice and...
Shodor Education Foundation
Shodor Interactivate: Lesson: Box Plots
This lesson plan introduces quartiles and box plots. It contains an activity and discussion. Supplemental activities about how students can represent data graphically are also included.
Education Development Center
Tune in to Learning: Understanding Mean, Median and Mode
Have you ever wondered what the difference is with mean, median, and mode? Here are some exercises that will help you understand what each is.


