Curated OER
Take a Walk
Sixth graders graph acceleration and practice using the metric system. In this physics lesson, 6th graders take turns timing each other as they walk 15 meters. Students then chart and graph their data using the metric system.
Curated OER
Domino Dash
In this speed worksheet, students use dominoes to measure the average speed of rows falling over. Students make a line graph to show the relationship between the length of the domino row and the time. Students answer 8 questions about...
Curated OER
Acceleration and Average Speed
In this acceleration and average speed worksheet, students learn the equations for acceleration and average speed. They match 6 variables with their quantities, they identify speed vs. velocity and scalar vs. vector and they solve 4...
Curated OER
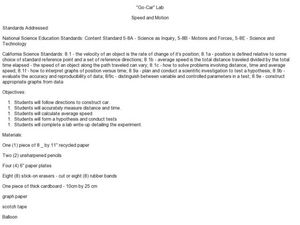
"Go-Car" Lab
Young scholars construct a car based on directions given. In this physics lesson, students calculate average speed using distance and time information. They collect data and create a graph of distance vs. time.
Curated OER
Twelve Average Speed/Rate Word Problems
For this word problem worksheet, learners solve twelve word problems discussing average speed or rate. The solutions are provided.
Curated OER
Calculating Speed Practice
In this speed worksheet, high schoolers calculate the average speed of objects traveling a given distance for a given amount of time. This worksheet has 5 problems to solve.
Curated OER
More Practice Calculating Speed
In this speed worksheet, students calculate the average speed of an object or the distance an object travels. This worksheet has 13 word problems.
Curated OER
Calculating Speed
In this speed learning exercise, students calculate the average speed of an object or the distance an object travels at a certain speed in 11 word problems.
Curated OER
Using Quantitative Statements to Solve Problems
In this equations worksheet, students use quantitative statements to sole for average speed. This worksheet has 4 problems to solve.
Curated OER
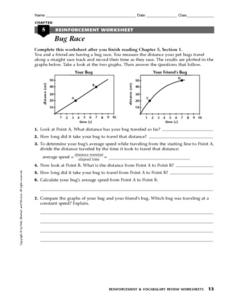
Bug Race
In this motion learning exercise, students compare two graphs showing a bug's distance traveled over time. Students calculate the average speed of the bugs and determine which bug was traveling at a constant speed. This learning exercise...
Curated OER
Position vs. Time and Velocity vs. Time Graphs
For this constant velocity worksheet, students use data of position vs. time of a roller-skater to determine speed, acceleration, or deceleration at different points along the path. Students rank graphs according to average velocity and...
Curated OER
Hot Wheelin' Physics
In this physics worksheet, students complete a lab activity and record their results in the charts shown. They calculate the speed for each trial using the total time and total distance. Students also graph their results.
Curated OER
Speed and Distance
In this speed worksheet, learners create time vs. distance graphs to answer questions about average speed, average velocity, and acceleration. This worksheet has 3 problems to solve.
University of California
Ucla: Speed and Velocity
Discusses the meaning of velocity in terms of a graphical representation. Calculus-based discussion. Good graphics.
Science Education Resource Center at Carleton College
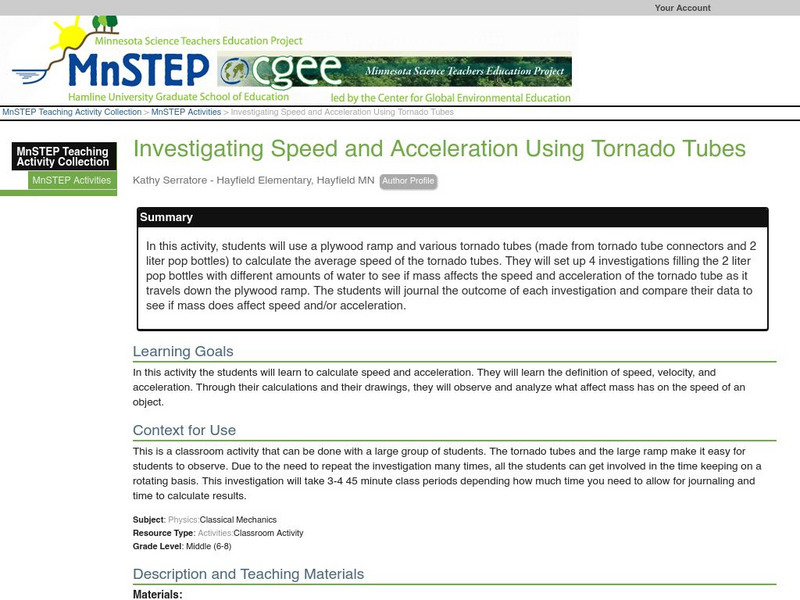
Serc: Investigating Speed and Acceleration Using Tornado Tubes
In this activity, students will use a plywood ramp and various tornado tubes (made from tornado tube connectors and 2 liter pop bottles) to calculate the average speed of the tornado tubes. They will set up 4 investigations filling the 2...
CK-12 Foundation
Ck 12: Average Velocity
[Free Registration/Login may be required to access all resource tools.] In this short tutorial, students investigate the meaning of average speed and velocity.
OpenStax
Open Stax: Time, Velocity and Speed
In the following interactive module, students will begin to explain the relationships between instantaneous velocity, average velocity, instantaneous speed, average speed, displacement, and time. They will calculate velocity and speed...
Science Buddies
Science Buddies: Project Ideas: The Biomechanics of Pitching
The goal of this sports science fair project is to learn more about the biomechanics of baseball pitching. The student will investigate if stepping forward and the length of the step affects the speed of the pitch. The Science Buddies...
CK-12 Foundation
Ck 12: Episd: Position Time Graphs
[Free Registration/Login may be required to access all resource tools.] Understand how to evaluate data presented in graphs based on speed and velocity calculations.
CK-12 Foundation
Ck 12: Episd: Speed
[Free Registration/Login may be required to access all resource tools.] Understand what speed is and how to calculate it in one dimension motion.
CK-12 Foundation
Ck 12: Episd: Average Speed, Velocity, and Instantaneous Velocity
[Free Registration/Login may be required to access all resource tools.] Understand how to apply proper calculations to determine speed and velocity and clarify the meaning of instantaneous velocity.
Texas Instruments
Texas Instruments: Falling Down
In this activity, students will determine the average speed of a falling object. They will observe whether or not changing the mass and keeping the same shape have an effect on the average speed of the object.
Texas Instruments
Texas Instruments: Graphing Motion: Instantaneous and Average Speed
Students are introduced to the calculator as a graphing tool and distinguish between average speed and instantaneous speed.
Science Education Resource Center at Carleton College
Serc: Investigating Speed and Velocity
In this investigation, middle schoolers will work in groups to design a model roller coaster, which will be used to clock the fastest speed for the rider (ball bearing/marble) The groups will build roller coaster models and modify and...


