Shodor Education Foundation
Shodor Interactivate: Pie Chart
Students investigate how a pie chart can be used to display data graphically. The resource includes the activity and instructor resources.
National Center for Ecological Analysis and Synthesis, University of California Santa Barbara
Ucsb / Pie Graphs (Piece of Cake)
This page gives an example and easy-to-understand description of a pie graph (circle graph.) Also provides an opportunity for students to test their abilities to read a pie graph.
PBS
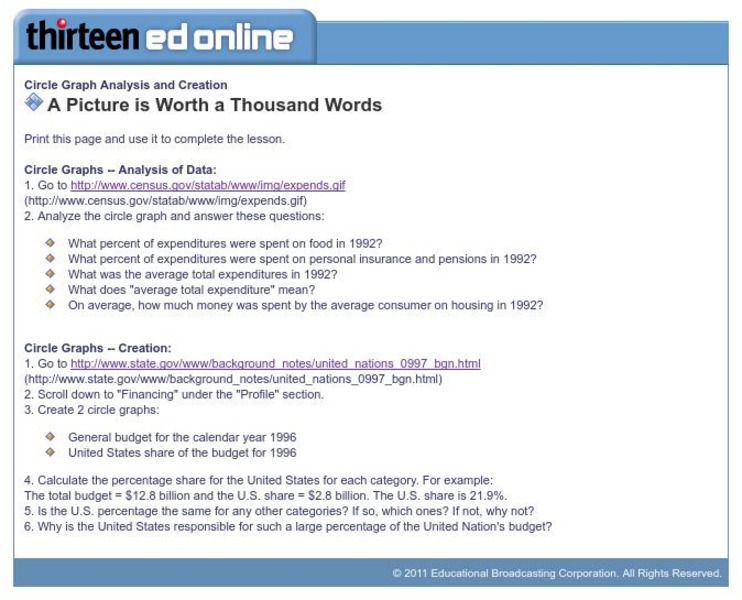
Wnet: Thirteen: Circle Graph Analysis and Creation
This site, which is provided for by WNET, gives a great way to practice using circle graphs through these exercises. One is analyzing a pie graph from the Census Bureau and the other creating pie charts using government data.
Wolfram Research
Wolfram Math World: Pie Chart
This page briefly discusses the use of pie charts (or circle graphs) in representing data. Provides detailed information for understanding.
National Council of Teachers of Mathematics
Nctm: Illuminations: Circle Grapher
A computer applet that will draw any circle graph with student's data input.


