Curated OER
When Will We Ever Use This? Predicting Using Graphs
Here are a set of graphing lessons that have a real-world business focus. Math skills include creating a scatter plot or line graph, fitting a line to a scatter plot, and making predictions. These lessons are aimed at an algebra 1...
Curated OER
Is there Treasure in Trash?
More people, more garbage! Young environmentalists graph population growth against the amount of garbage generated per year and find a linear model that best fits the data. This is an older resource that could benefit from more recent...
Curated OER
Using Data Analysis to Review Linear Functions
Using either data provided or data that has been collected, young mathematicians graph linear functions to best fit their scatterplot. They also analyze their data and make predicitons based on the data. This lesson is intended as a...
University of South Florida
Fcat: Bungee M&m's: Teacher Notes
Students will learn how to draw a line of best fit for a set of data using m&m's and a "Bungee."
University of South Florida
Fcat: Shaq's Hand/foot Span: Teacher Notes
Students compare their own hand/foot span to Shaquille O'Neal's, then graph the data & construct a best-fit line. They can then use the information to investigate the proportionality of the human body.
University of South Florida
Fcat: View Tubes: Teacher Notes
In this online activity use view tubes to collect data and determine the linear relationship and line of best fit.
Texas Instruments
Texas Instruments: Numb3 Rs: How Much Can They Win?
Based off of the hit television show NUMB3RS, this lesson has students create data points from given information, plot those points, and then create a line of best fit. This is done in the context of playing blackjack, although the...
Texas Instruments
Texas Instruments: Run Me a Linear Regression
This activity is designed to give students the opportunity to estimate the least squares line given a set of points. The students are then able to check their "best fit" line by running a linear regression using the graphing calculator.
Texas Instruments
Texas Instruments: Getting Started With the Ti Navigator: If the Line Fits
This lesson introduces students to Activity Center and introduces students to the use of symbolic algebra to represent real world situations. They will use Activity Center to contribute equations that model a linear relationship and then...
University of Illinois
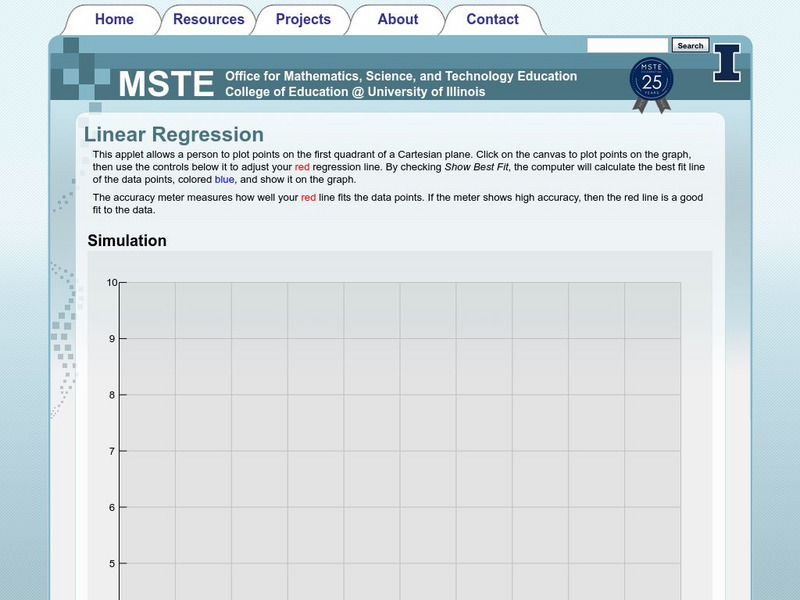
University of Illinois: Linear Regression Applet
This applet allows you to plot up to fifty points and it will display a best fit line and give you the slope of that line.
Houghton Mifflin Harcourt
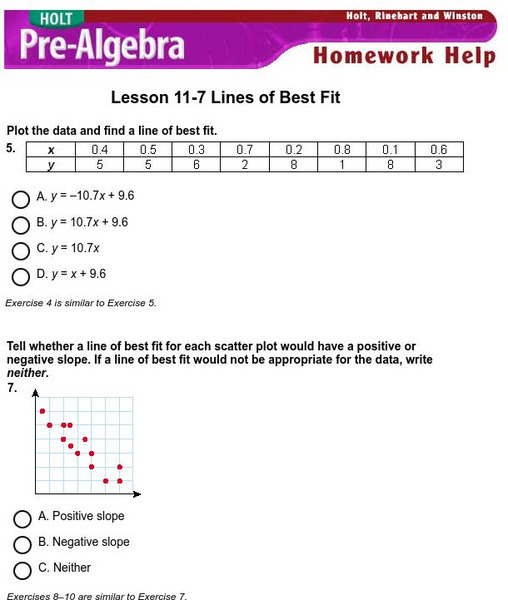
Holt, Rinehart and Winston: Homework Help Independent Practice: Lines of Best Fit
Get independent practice working with lines of best fit. Each incorrect response gets a text box explanation and another try. Correct responses are confirmed.
Varsity Tutors
Varsity Tutors: Hotmath: Practice Problems: Fitting Equations to Data
Five problems present practice using data to write equations and linear models. They are given with each step to the solution cleverly revealed one at a time. You can work each step of the problem then click the "View Solution" button to...


