Vision Learning
Visionlearning: Statistics: Introduction to Inferential Statistics
An introduction to inferential statistics to find relationships and patterns in datasets.
Sophia Learning
Sophia: Creating a Good Survey and Analyzing the Results
In this activity, students will learn how to develop a sample survey while also using inferential statistics to solve real-world problems.
Texas Instruments
Texas Instruments: Why Aren't There More Reds in My Bag?
Students use small bags of M&M's to make predictions, gather data, and display color distribution results in a circle graph. They explore the concept of ratios and sample size.
Texas Instruments
Texas Instruments: What Is a Kanban?
In this activity, students use the CellSheet Application to understand how to track inventory and predict future trends based on average daily use. They will collect data, analyze it and make predictions. They also learn to use linear...
Texas Instruments
Texas Instruments: Ti Using the Chi Squared Significance Test
In this activity, students will apply the Chi Squared test for independence to a data set of high school AP Statistics Exam scores. They will set up a two-way table and calculate the chi squared test statistic by hand.
Texas Instruments
Texas Instruments: Statistics
In this activity, students use the statistical features of the calculator to calculate statistical results, perform regressional analyses, and graphically display statistical data.
Texas Instruments
Texas Instruments: Taste Test
Students collect sample data and use the calculator to create pictographs, bar graphs, and pie graphs to demonstrate the favorite brand in the sample data.
Texas Instruments
Texas Instruments: Testing Goodness of Fit and Two Way Table Chi Square
Students perform chi-square tests to see if data follows a hypothesized distribution. They also study the two-way table analysis.
Texas Instruments
Texas Instruments: Graphing Calculator: Problem Solving and Investigations
Over 30 reproducible, motivating investigations designed especially for middle school students to use with any TI Graphing Calculator model.
Texas Instruments
Texas Instruments: You're Probably Right, It's Wrong
In this activity, students perform a simulation to guess answers on a test and determine the experimental probability of passing the test. They then compare it with the theoretical probability.
Texas Instruments
Texas Instruments: Analyzing Variance (Anova)
Students analyze variances of various data samples.
Texas Instruments
Texas Instruments: Comparing Distributions of Univariate Data
Students compare univariate data distributions using statistical concepts like box plots, stem plots, and histograms.
Texas Instruments
Texas Instruments: Summarizing Distributions of Univariate Data
Students understand statistical concepts like center of data and the amount of data variation from the center. They calculate the measures of the center of a distribution and the measures of spread for the data collected as a list....
Texas Instruments
Texas Instruments: Some Nonparametric Tests
Students explore nonparametric tests for dependent and independent data samples.
Texas Instruments
Texas Instruments: Collecting Data
In this activity, students investigate how to use random numbers to collect samples and how to randomly assign subjects to experiments to collect data. They also use the CBL system to collect data in real time.
Texas Instruments
Texas Instruments: Assumptions and Conditions for Significance/hypoth
These questions cover the criteria for inference tests: "conditions," when the actual data is given, and "assumptions," when the data is missing and only summary statistics are given.
Texas Instruments
Texas Instruments: Z Tests
Students will be lead through the process of using the calculator to solve z test problems.
Texas Instruments
Texas Instruments: Tests of Significance
Students understand how tests of significance can be performed with confidence intervals. They use a simulation to clarify the meaning of a hypothesis. Students examine large sample tests for a proportion, mean, difference between two...
Texas Instruments
Texas Instruments: Sampling Distribution of Differences
This activity covers the distribution of a difference between two independent sample proportions or two independent sample means.
Texas Instruments
Texas Instruments: T Test and T Interval #1
In this activity, students will to apply inferential statistics using a T-Test and T-Interval to analyze a random sample and determine the validity of a report.
Texas Instruments
Texas Instruments: Special Cases of Normally Distributed Data
Students perform single and two-sample t procedures to investigate special cases of normally distributed data. They explore inference for a least-square regression line, including the confidence interval.
Texas Instruments
Texas Instruments: Describing Categorical Data
Students analyze the distribution of categorical data. They calculate percents and visually compare the data sets with a bar chart.
Texas Instruments
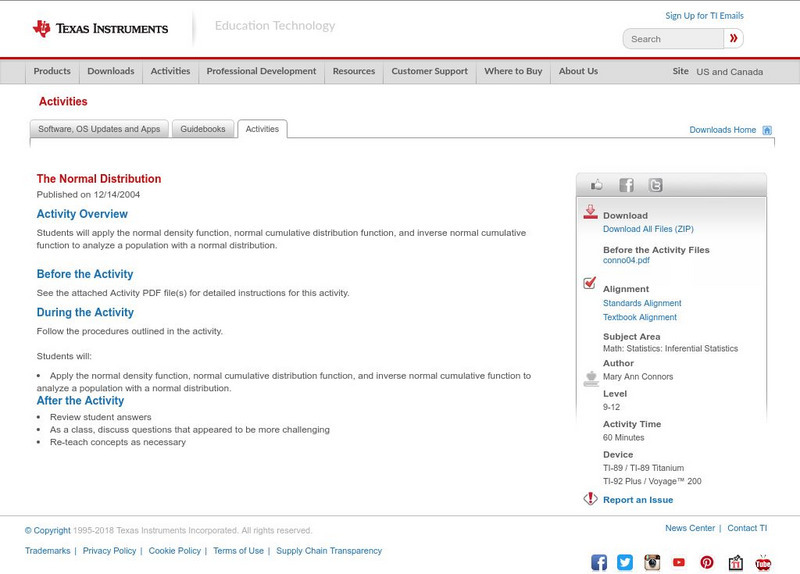
Texas Instruments: The Normal Distribution
In this activity, students will apply the normal density function, normal cumulative distribution function, and inverse normal cumulative function to analyze a population with a normal distribution.
Texas Instruments
Texas Instruments: The Normal Distribution
Students graph normal distributions, shade desired areas, and find related probabilities. They graph Normal probability scatter plots to check the normal (linear) shape of a data distribution.


