Curated OER
Months of the Year
Students practice interviewing. In this months of the year lesson, students interview at least five adults working in their school to gather data on when their birthdays occur. Students create a master calendar for the school.
Curated OER
Letter Survey
In this letters worksheet, students complete a tally table of the most letters written in English and answer questions about them. Students complete 10 sections of the tally table and answer 4 questions.
Curated OER
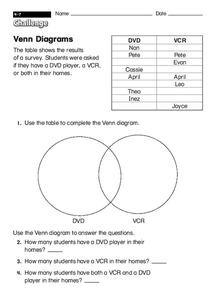
Venn Diagrams
In this Venn diagram instructional activity, learners insert the answers of a survey about electronics into a Venn diagram. Students complete the diagram and then answer 3 short answer questions.
Curated OER
!-Survey Project
Students explore the process of the production of statistical information. In this statistical analysis lesson, students design, process and report on a survey of their own creation. Additionally, the...
Curated OER
Eye Color
Students take a survey on eye color and plot their findings into a graph. In this eye color lesson plan, students take a class survey of everyone's eye color and learn how to put those findings into a graph.
Curated OER
Recycling at home survey
Students fill out a survey that asks questions about recycling at home. In this recycling at home lesson plan, students fill in 7 different questions about recycling at home.
Curated OER
Class Survey 1: Food and Drink
For this food and drink worksheet, students fill in a survey asking other students about their preferred food and drink choices. Students survey 14 other students.
Curated OER
Favorite And Least Favorite Vegetable Survey and Bar Graph
In this favorite and least favorite vegetable survey, students create a bar graph after they survey and keep track of data on this graphic organizer.
Curated OER
Countries Survey: Where are You From?
In this ESL activity worksheet, students practice English conversations as they ask 8 different classmates where they are from and where they live.
Curated OER
Circle Graphs
In this circle graphs worksheet, students solve 10 different problems that include reading various circle graphs. First, they use graph 1 to determine how many students preferred which sport. Then, students use graph 2 to determine the...
Curated OER
ESL Survey Worksheet- "Do You Have...?"
In this ESL survey worksheet, learners look at small pictures of items. They record the name of each student and check off whether they do or do not have that item. They complete 6 survey questions which include items such as a bike, a...
Curated OER
General Description of Site
For this earth science worksheet, students identify what a site matrix is and that is composed of a sandstone mixture. They excavate each quadrant and write detailed journal entries. Students also complete a site map that illustrates...
Curated OER
Level 2 Fraction Sets
In this mathematics activity, learners solve various word problems by selecting the correct fraction for each response. There are eight problems to solve on the sheet.
Curated OER
Formula 1 Datafiles
In this computer activity, students load ViewPoint and open the file for formula 1. Then they investigate and take notes on the winning drivers, teams and their cars. Students also plot the graph of countries to see who hosted the one...
Curated OER
Football Datafile
In this computer worksheet, students load ViewPoint and open and search the file on football from 2002. They respond to several questions about every Premier League football match in the 2002-03 season. Students also plot a pie chart of...
Curated OER
Survey: What is Your Favorite Rainforest Animal?
In this favorite rainforest animal survey worksheet, 1st graders will survey their classmates about which animal is their favorite. There are 12 animal choices. Students will record responses by making tally marks.
Curated OER
Surveying: 19 Chains and 50 Links
Through an interdisciplinary lesson, emerging engineers explore the history of surveying systems. After discussing various systems, they perform surveys on printable pages. Using their geometric skills, they physically stake out plots...
Curated OER
The Human Line Plot
Fifth graders collect data and use charts and line plots to graph data. Through class surveys, 5th graders collect data concerning a particular subject. They graph their data using a line graph. Students make inferences and predictions...
Curated OER
And the Survey Says...
Students use technology to input, retrieve, organize, manipulate, evaluate, and communicate information; apply appropriate technologies to critical thinking, creative expression, and decision-making skills. They collect and explore data...
Curated OER
Money Circulation: A Story of Trade and Commerce
Students are introduced to the meaning, symbolism, and value of the quarter. They determine the percentage of total monetary value held in quarters and graph the results. Students infer about the U.S. Mint's distrubution of coins. They...
Curated OER
The Expanding United States
Learners display comprehension of the concept of nationalism. They design a tool to conduct a survey. Students conduct a survey to find out which groups learners feel affiliated (family, nation, religion, school, etc). They complie...
Curated OER
Political Polling
Students examine the roll of polling in elections and assess information provided by polls. They define the term survey. Pupils conduct a poll, individually each student answers the questions, as a group, tally the results. Students...
Curated OER
Data From Interviews
Students create and conduct a survey about favorite foods, gather and represent the data, interpret data and make predictions to present to the class. They create and use interview questions to gather data. Pupils are explained that...
Curated OER
Pie Charts
The teacher conducts a survey of each student's favorite color. The teacher then creates a pie chart identifying the information gathered. The students display mastery by creating their own pie chart displaying the same information.


