Curated OER
Food Ways - Graphing
Sixth graders choose the appropriate graph to display collected data. They interview each other on what foods they eat. They also interview elders and find out what types of food they grew up eating. They create graphs to display the...
Curated OER
Data Analysis & Probability
Pupils make predictions based on survey results. They calcuate sample proportions. Students estimate the number of voters in their district preferring the democratic candidate using their sample results. They review sample proportions...
Curated OER
Are We Alone
Seventh graders collect/analyze data and draw conclusions; support reasoning by using a variety of evidence; construct logical arguments; access information at remote sites using telecommunications; apply the concept of percent;...
Curated OER
Students Speak Up -- Lesson 2
Students define new words such as computer, internet and technology to begin the lesson. In groups, they discuss the definitions with the class and take a survey on the same topics. They discuss the ways technology and the internet can...
Curated OER
Take a Survey!
Second graders discuss proper uses of the Internet. They complete the 8-question survey by selecting their favorite answer for each question. They click one time in the white circle to choose an answer and click Next at the bottom on...
Curated OER
'The Flood'
Students hear the story "The Flood," and take a survey of the favorite pet animals in the class. They take the information complied in the survey and make a bar graph to show favorite pet animals using the computer program KidPix.
Curated OER
How is our place connected to other places?
Second graders conduct a survey, they record their data with the help of maps. They use an aerial photo or Ordnance Survey map, 2nd graders pinpoint specific places and add them to a legend using the drawing tools. Students use...
Curated OER
Why do people write?
Students brainstorm how and why people use writing in their
everyday lives and record answers on chart paper. They create a survey of questions in the computer lab then chart the responses they received from the survey then discuss the...
Curated OER
Which Pizza
Seventh graders investigate the data related to finding the favorite type of pizza that 7th graders eat. The data is analyzed taken from a survey that focuses on the toppings of the pizza and not the brand. Students practice the sampling...
Curated OER
Create a Survey and Analyze the Data
Eighth graders create their survey discussing wording used in surveys and try to create one that is unbiased. They distribute the survey to the middle school but not during instructional time. They then collect and analyze the data...
Curated OER
How to Construct and Conduct Successful Interviews
Students conduct surveys to gain statistical information. They examine the four main types of surveys and three types of samples. Students create a practice survey, conduct field studies, and create a survey for their hometown. Students...
Curated OER
Inventors Unit Survey
Students develop and conduct a survey for their inventors unit. They create a five question survey and tally the survey results, and create a graph using Microsoft Word and Graph Club 2.0.
Curated OER
One Square Meter
Learners examine various ecosystems using scientific inquiry. Using the local area, they assess the characteristics and conditions in one square meter. They report their findings in the form of a survey map and data sheet. They...
Curated OER
Fast Food Survey Using Bar Graphs
Second graders conduct survey and sort data according to categories, construct bar graph with intervals of 1, and write a few sentences about their graphs.
Curated OER
Opening a Restaurant
Students design a survey of the public as to what type of food should be served in restaurant that they are "planning" to open.
Curated OER
Career Interest Record Update
Second graders complete a Career Interest Record and compare it to their record from the previous year to see how they have changed.
Curated OER
Surveying During a Basketball Game
Tenth graders conduct a survey at a high school basketball game. They compile and present the data as histograms or bar graphs.
Curated OER
Survey Strategy
Students develop their research techniques and their ability to question and think critically about democracy and the parliamentary system of government.
Curated OER
Survey Say...
Students examine a variety of charts and graphs that present data in a format that is easy to read. They work in groups to conduct a survey amongst their classmates. The data collected from the survey is then put on a bar graph.
Curated OER
Constitutional Amendments Survey
Students conduct Constitutional Amendments Survey to create an opinion poll forum.
Curated OER
The Household Environment Survey
Students examine data collected from a national survey of household environmental practices to develop their own questionaires. Once they have their own survey questions, students conduct their own investigations, and report their findings.
PBS
Pbs Learning Media: Harry's Allergy
Harry keeps track of the number of times he sneezes in certain locations to try to diagnose the cause of his allergy in this video segment from Cyberchase.
US Department of Labor
Bureau of Labor Statistics: Surveyor
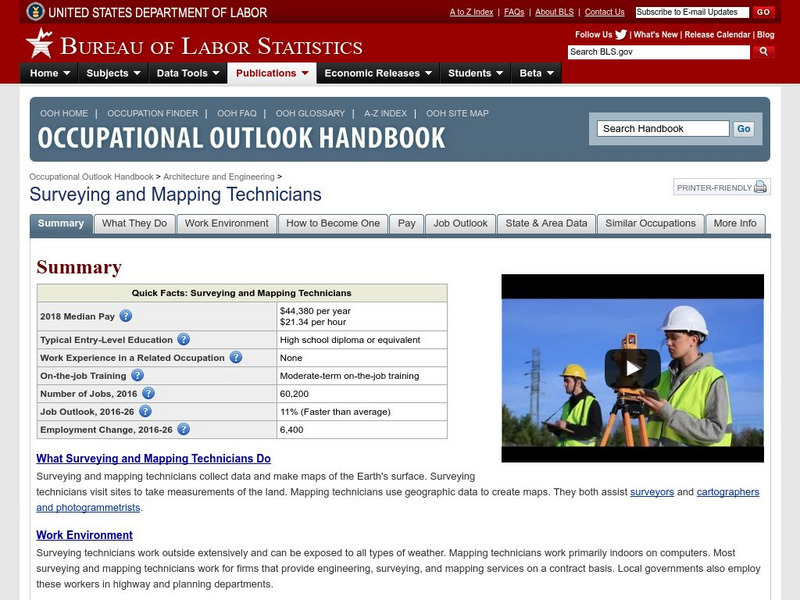
This site will explain what Surveyors, Cartographers, Photogrammetrists, and Surveying Technicians do for a living. It explains everything you would want to know.
Science Buddies
Science Buddies: Candy Confusion: Can Small Children Mistake Medicine for Candy?
Many medicines come in bottles with special child-proof caps so that small children can't accidentally open the bottle and eat the pills. To a small child who can't read the label, the pills might look just like candy. This project helps...


