Curated OER
Unit 6b -Year 5
If you have some 9-10 year olds who are ready for some 5th year math, then check out this UK math unit. There are 172 slides that cover all of the basic multiplication tables, relate those to division, fractions, sequencing, and an...
Curated OER
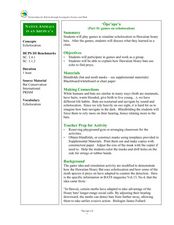
Games on Echolocation
Get a little batty with life science! This fun simulation game replicates how bats use echolocation to hunt moths in their native Hawaiian habitat. After creating blind folds and discussing some basic principles of echolocation, students...
Curated OER
The Mitten
Explore the Ukraine through a reading of The Mitten. Readers will determine the sequence of events, cause and effect, make predictions, and find the main idea of the story. They also use math skills to make charts and graphs. Finally,...
Curated OER
Timetable Problems
Learning how to read a schedule and determine when you will depart and arrive is an everyday skill that builds competency in chart reading, subtraction, elapsed time, and counting on. Learners discuss how to solve timetable problems and...
Wisconsin Online Resource Center
Oversized Inch
Each member of the class creates their own paper ruler. Using their ruler, kids walk around the room measuring the objects you've specified. Discuss how items should be measured to the 16th of an inch, the smallest unit on their ruler....
Curated OER
Counting Coins
Second graders identify a quarter, dime, penny, nickel, and dime. They match the coin with it's monetary value, collect data on excel spreadsheet, and create a graph in Excel. Students participate in group activities.
Curated OER
What Came From Where?
Students research patterns and networks of economic interdependence. They work cooperatively to create 3-dimensional representations of common objects and charts describing the objects' components and countries of origin. Students...
Curated OER
Maps and Modes, Finding a Mean Home on the Range
Fifth graders investigate data from maps to solve problems. In this data lesson, 5th graders study maps and collect data from each map. Students present their data in a variety of ways and calculate the mode, mean, median, and range.
Curated OER
Solving Multi-Step Problems
Use this multi-step problems worksheet to have your charges complete multi-step problems including money, fractions, charts, and more. They complete 30 problems total.
Curated OER
Problem Solving and Puzzles: 3
Your class can use this to warm up or to discuss their problem solving strategies. They review the 8's times tables, relate the multiplication problems to division, then use a chart to solve a word problem involving money.
Curated OER
Counting
First graders explore collecting data. They collect data using a data collection sheet and enter the data into Excel. Students create graphs using Excel. They share their graphs with the class.
Curated OER
This is My Neighborhood
Students predict the things that they may see, smell, or hear in their neighborhood. They take part in a neighborhood walk, creating a rough map of their neighborhood as they go. Upon return to the classroom, students create a final map...
Curated OER
Logs, Charts, and Journals: What's On Your Plate?
Have your writers identify and use words that appeal to the senses. They create a chart of sensory words and record some of their favorites, then write a journal entry in which they describe eating at a restaurant using sensory details....
Curated OER
Navajo Weaving
Young scholars explore the Navajo culture. In this Navajo Indians lesson, students gain information about their weaving and dancing. Young scholars note the patterns in the weaving. Students create a dance that corresponds with the...
Raytheon
Data Analysis and Interpretation
For this data analysis and interpretation worksheet, learners use charts, graphs, statistics to solve 42 pages of problems with answer key included.
Curated OER
Percents Practice
In this decimals worksheet, students complete problems involving decimals, percents, fractions, word problems, and charts. Students complete 72 problems total.
Curated OER
Bird and Breakfast
Students examine winter birds. In this KWL chart lesson, students fill out the chart and view a PowerPoint presentation. Students then complete the chart and discuss winter birds.
Curated OER
Data Handling
In this data handling activity, students interpret data found in table, graphs and charts. They organize data and draw bar charts. This two-page activity contains 2 multi-step problems.
Curated OER
Then and Now
Students conduct research and use census data to compare different times and places. In this census lesson, students interpret data from charts and graphs, comparing census information from two time periods as well as from two different...
Curated OER
Sunshine Math-1
In this math skills activity, students answer 7 questions in which they use various basic math skills. They use number lines, charts, number blocks, a calendar and a ruler to complete this activity.
Curated OER
Handling Data
Students create a simple table in order to solve a problem. As a class, they create a simple data table in order to discover the number of letters in each student's name. This data is interpreted in order to answer questions and make...
Curated OER
Basic Algebra and Computers: Spreadsheets, Charts, and Simple Line Graphs
Young scholars, while in the computer lab, assess how to use Microsoft Excel as a "graphing calculator." They view visual representations of line graphs in a Cartesian plane while incorporating basic skills for using Excel productively.
Curated OER
Hopes and Dreams: A Spreadsheet Lesson Using Excel
Fourth graders read "The Far Away Drawer" by Harriet Diller and discuss the story as a class. After discussion, 4th graders create a t-shirt GLYPH about their hopes and dreams,share their information with the class and create spreadsheets.
Curated OER
Quadratic Applications
For this quadratic applications worksheet, high schoolers complete graphs, charts, comparison charts, and more having to do with quadratic equations. Students complete 5 different activities.


