Curated OER
A Picture is Worth a Thousand Words: Introduction to Graphing
Students practice graphing activities. In this graphing lesson, students discuss ways to collect data and complete survey activities. Students visit a table and graphs website and then a create a graph website to practice graphing.
Curated OER
Pizza Possibilities
Middle schoolers create and interpret line plots, bar graphs, and circle graphs. The lesson assumes mastery of conversions from fraction to decimal to percent, construction of angles, and at least an introduction to graphs displaying data.
Curated OER
Circle Graphs
In this circle graphs worksheet, learners solve and complete 8 different problems that include word problems referring to two different circle graphs shown. First, they follow the directions for each problem and complete the table that...
Curated OER
Your Tax Dollars at Work
In order to understand how tax dollars are spent, young economists use given data and graph it on a circle graph. Circle graphs are highly visual and can help individuals describe data. A class discussion follows the initial activity.
Curated OER
Circle Graphs
Fifth graders explore to find the central angle and percent. In this circle graph lesson, 5th graders use formulas to calculate the central angle and a protractor to create their graph. Students complete a graphing sheet for homework.
Curated OER
Circle Graphs and Percents
In this circle graph and percentages worksheet, students fill in a chart, write percentages, calculate discounts, and more. Students complete 4 sets of problems.
Curated OER
Dealing with Data
Seventh graders collect and analyze data. In the seventh grade data analysis lesson, 7th graders explore and/or create frequency tables, multiple bar graphs, circle graphs, pictographs, histograms, line plots, stem and leaf plots, and...
Curated OER
Choose an Appropriate Graph
In this graphs learning exercise, students solve 6 fill in the blank problems where they choose the most appropriate type of graph for each set of data and explain why they chose that type. Students use bar graphs, histograms and circle...
Curated OER
Problem-Solving Application: Make a Circle Graph
In this circle graphs worksheet, students analyze a data table about the activities in a day. Students then use this data to make a circle graph. Students answer 6 questions about the graph.
Curated OER
Problem Solving Application: Using Circle Graphs
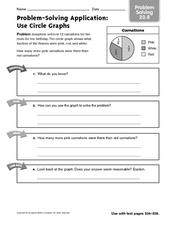
In graphing worksheet, 4th graders use the information from a circle graph about carnation sales to complete the steps of problem solving. They determine what they know, and how they can use the graph. They find how many more pink...
Curated OER
Making a Circle Graph of a Sample Budget
Students examine a sample budget and categorize the entries as a group. Then in small groups they convert budget category totals to percents and degrees to make a circle graph related to a sample budget.
Curated OER
Creating Circle Graphs with Microsoft Excel
Students create graphs of circles. In this geometry lesson, students use Microsoft Excel to create graphs. They construct the graphs using paper and pencil as well as the computer.
Curated OER
Graphs
Learners investigate circle and bar graphs. In this middle school mathematics lesson, students determine which kind of graph is suitable for a given situation and create circle and bar graphs.
Curated OER
Introduction to Graphs: Bar Graphs, Line Graphs, Circle Graphs
In this graphing data worksheet, students answer 5 short answer questions about graphs. Students determine which type of graph best represents various data sets.
Curated OER
Making Circle Graphs
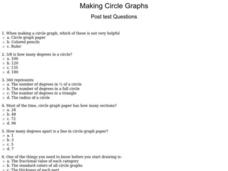
In this circle graphs instructional activity, students answer multiple choice questions about how to make circle graphs. Students answer 10 questions total.
Curated OER
Class Trip: Circle Graphs
In this circle graph learning exercise, students fill in a graph showing given percentages about a class trip and explain why a circle graph would be used, then compete another circle graph with different given information.
Curated OER
Circle Graph: Snoozing Animals
In this circle graphs worksheet, students make a circle graph for each animal shown in a chart showing average number of hours each animal sleeps and is awake.
Curated OER
Circle Graphs
Sixth graders interpret, create, and display data in a circle graph. In this circle graph lesson plan, 6th graders use a compass, protractors, pizza boxes, and more to create a circle graph and analyze the data they put into it.
Curated OER
Use Information in Line, Bar, Circle, and Picture Graphs to Make Comparisons and Predictions
Eighth graders explore the concept of graphs. In this graphs lesson, 8th graders compare and contrast picture graphs, bar graphs, line graphs, and circle graphs. Students examine each type of graph and answer questions and make...
Curated OER
Problem-Solving Application: Use Circle Graphs
In this problem-solving worksheet, 5th graders problem-solve 2 mathematical equations involving 4 key steps and 2 circle graphs.
Curated OER
Problem-Solving Application: Use a Circle Graph
In this graphing worksheet, 4th graders use a circle graph with information about orchestra instrument to answer 5 questions. They examine the graph to find the information needed to problem solve each answer.
Curated OER
Problem-Solving Application: Use Circle Graphs
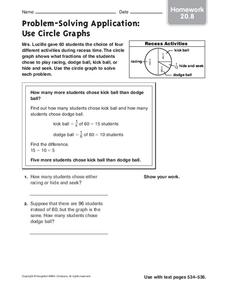
In this problem solving worksheet, students analyze the information in a circle graph about recess activities. Students use this graph to solve 2 application problems.
Curated OER
Using Circle Graphs
In this circle graphs worksheet, students read a story about buying craft materials. Students examine the circle graph that shows how much spent on each type of material. Students then solve 3 problems using the data shown.
Curated OER
Circle Graphs
In this circle graphs worksheet, learners solve 10 different problems that include reading various circle graphs. First, they use graph 1 to determine how many students preferred which sport. Then, learners use graph 2 to determine the...


