Curated OER
pH Curves and Indicators
Glimpse how pH changes during an acid-base titration by examining graphs. It contains not only graphs of pH changes, but also a chart summarizing what indicator to choose for different changes. This is not truly a worksheet, but an...
Curated OER
Acid-Base Titration
High schoolers determine the concentration of an unknown solution. This task assesses students' abilities to state hypothesis, develop procedures for investigation, plan for recording and organizing observations and data, collect data,...
University of Southern California
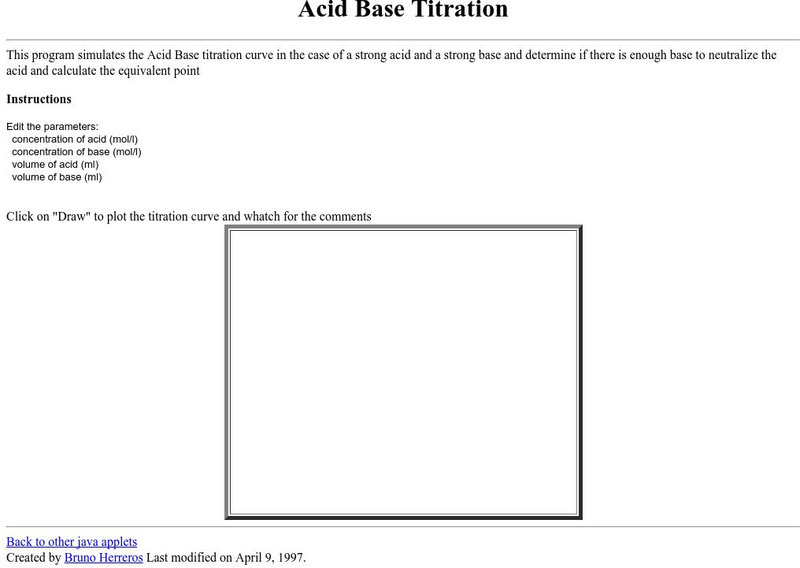
Usc Chemistry: Acid Base Titration
This java site allows students to enter the concentration and volume of the base and acid and see the titration curve that is produced.
Other
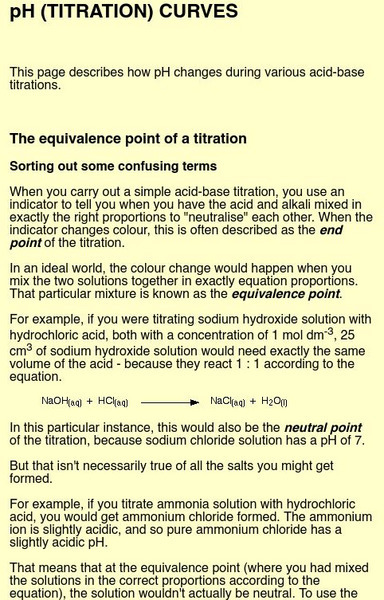
Chemguide: P H Curves (Titration Curves)
On this site from Chemguide, the titration curves for various acid-base combinations (weak acid/strong base, strong acid/strong base, etc.) are talked about with examples of each given.
Other
Aus E Tute: Acid Base Titration Curves
This website has a table which gives the typical titration curves for different combinations of acids and bases (i.e., strong/weak, strong/strong, weak/weak, etc.) Also contains an in-depth example problem in which a titration curve is...


