Sophia Learning
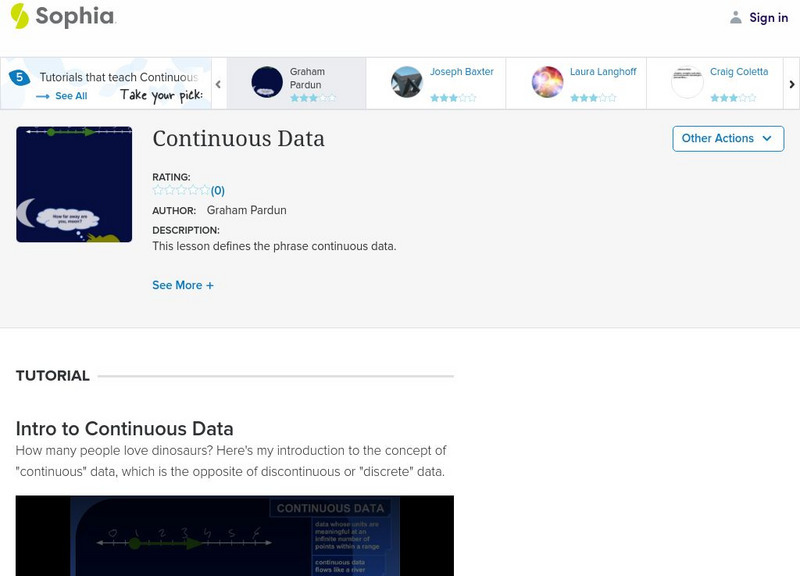
Sophia: Continuous Data
Continuous data is defined and examples are given in this lesson.
Sophia Learning
Sophia: Discrete Data
Explore the term discrete data and look at examples for further explanation.
Annenberg Foundation
Annenberg Learner: Cast Your Vote!
Cast your vote and answer some questions on the accuracy, usefulness, and impact of polls. Then read about what role polls play in an election.
Science Education Resource Center at Carleton College
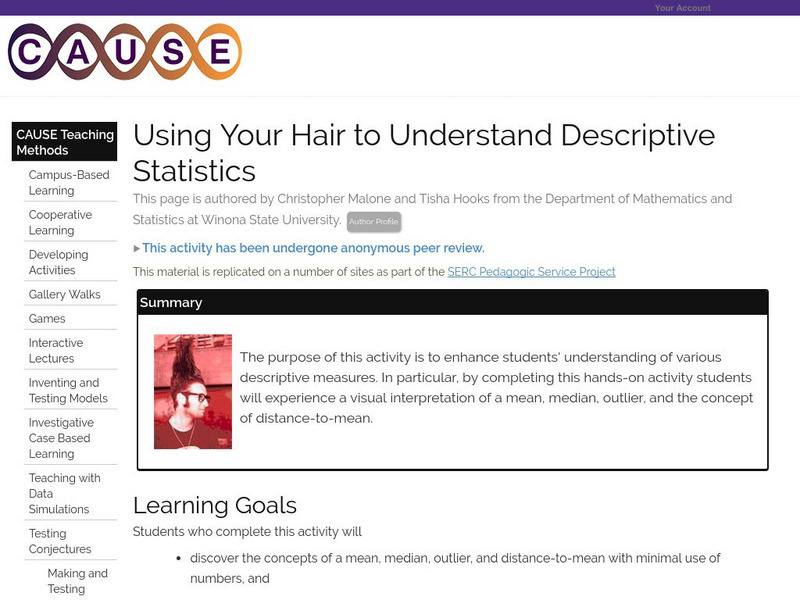
Serc: Using Your Hair to Understand Descriptive Statistics
Enhance students' understanding of various descriptive measures with a visual interpretation of a mean, median, outlier, and the concept of distance-to-mean.
Khan Academy
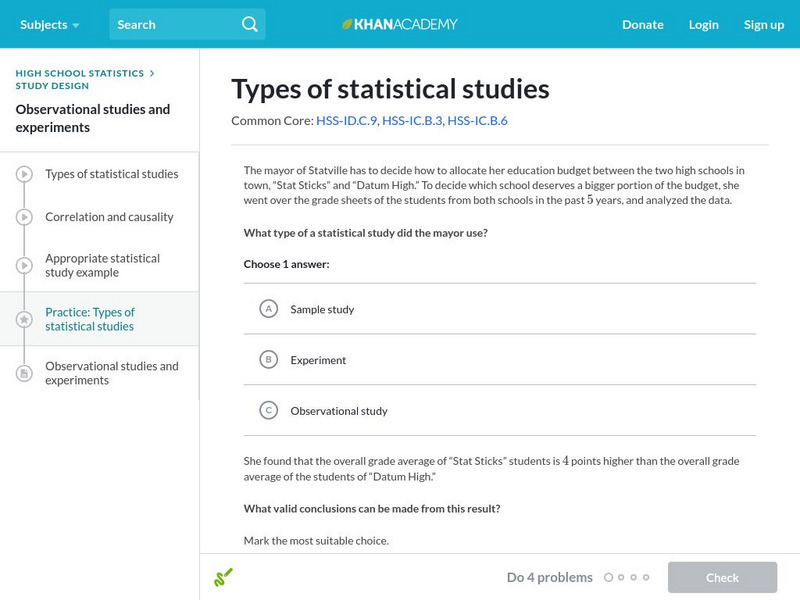
Khan Academy: Types of Statistical Studies
Determine if a statistical study is a sample study, an experiment, or an observational study. Students receive immediate feedback and have the opportunity to try questions repeatedly, watch a video or receive hints.
National Council of Teachers of Mathematics
The Math Forum: Data Collecting Project Stats Class
This lesson plan provides the teacher with all the necessary handouts and directions to give a statistics class when they are ready to complete a thorough survey project. Broken into five parts, it takes the students through the...
Oswego City School District
Regents Exam Prep Center: Practice With Organizing and Interpreting Data
Several problems are presented to test your skills in creating and interpreting frequency tables, pie charts, box-and-whisker and stem-and-leaf plots.
Oswego City School District
Regents Exam Prep Center: Multiple Choice Practice: Working With Data
Test your knowledge of working with data by taking this twenty question multiple-choice practice test. Use a graphing calculator to help with any graphing problems and check your answers at any given time throughout the test.
CK-12 Foundation
Ck 12: Algebra: Systems Using Substitution
[Free Registration/Login may be required to access all resource tools.] Solve linear systems by using substitution.
Illustrative Mathematics
Illustrative Mathematics: S Ic, S Id High Blood Pressure
The purpose of this task is to assess understanding of how study design dictates whether a conclusion of causation is warranted and whether there can be a cause-and-effect conclusion. Explanations are provided.
Illustrative Mathematics
Illustrative Mathematics: S Ic Words and Music Ii
Given a hypothetical situation, students will decide if this is an experiment or observational study and why? They will also learn the importance of random assignments in this particular example. Explanations are provided.
TED Talks
Ted: Ted Ed: David Mc Candless: The Beauty of Data Visualization
Listen and watch as David McCandless turns complex data sets into beautiful, simple diagrams. He suggests that information design is really important because we all like to visualize our information. [18:19]
Alabama Learning Exchange
Alex: M&m's and Blogs: Interpreting Data!
In this hands-on, technology-rich lesson, students will interpret data. The students will define words involving graphs, create a bar graph using M&M's, and post information from their findings on the internet. The students will also...
Alabama Learning Exchange
Alex: Beep! Beep! Move Over! I Am Going to Be Late!
During this lesson, young scholars will investigate how to "clear up" the "Traffic Jam." They will be using large manipulatives (their bodies), small manipulatives (carpet squares), and technology (the Java applet) to find the...
Alabama Learning Exchange
Alex: Probability
The purpose of this lesson is to begin the process of helping students to learn the basic principles of probability. The students will also collect data, interpret data, and determine the fairness of the game rock, paper, scissors.This...
Better Lesson
Better Lesson: Graphing Our Snack Mix: Review of Graphing
Second graders review how to make bar graphs, line plots, and pictographs by tallying the contents of snack mix and building graphs to show their data.
Better Lesson
Better Lesson: Graphing Data on a Graph
Second graders will be able to read and write data on a graph.
Better Lesson
Better Lesson: Graphing January's Weather
First graders graph the weather in Vermont for the month of January.
Better Lesson
Better Lesson: Graph Party
First graders will be involved in creating three different types of graphs and then be asked to answer questions about each representations data set.
Better Lesson
Better Lesson: 100 Students Project: Analyzing Survey Results
Sixth graders work in groups to analyze the survey data and plan their presentations for the 100 Students Project.
National Council of Teachers of Mathematics
Nctm: Illuminations: Handshakes
When the nine justices of the Supreme Court meet, they greet one another with a handshake to show harmony of purpose, even though their views may differ. How many handshakes occur? In general, how many handshakes occur when there are n...
National Council of Teachers of Mathematics
Nctm: Illuminations: State Names
Students use multiple representations to display how many times the letters of the alphabet is used in a state name. Concepts explored: stem and leaf, box and whisker plots, histograms.
Other
Nearpod: Introduction to Data Representation
In this lesson on representation data, students explore how to make dot plots, histograms, and box plots and learn about outliers in a data set.


