TeachEngineering
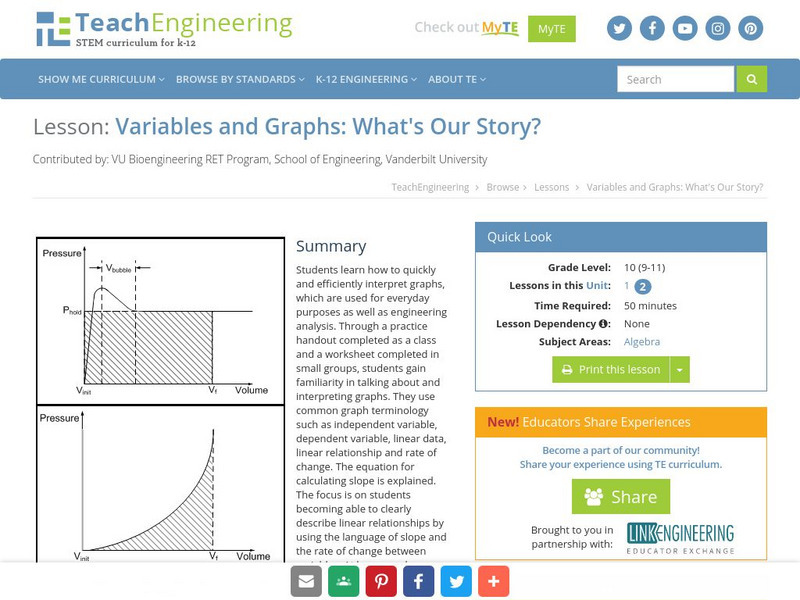
Teach Engineering: Variables and Graphs: What's Our Story?
Young scholars learn how to quickly and efficiently interpret graphs, which are used for everyday purposes as well as engineering analysis.
Scholastic
Scholastic: Math Maven's Mysteries: The Case of the Mysterious Money Trail
Pat Tern has been buying items all around town using counterfeit money. Help Math Maven identify a pattern to catch her before she deposits fake money into the Cashflow Bank.
Texas Education Agency
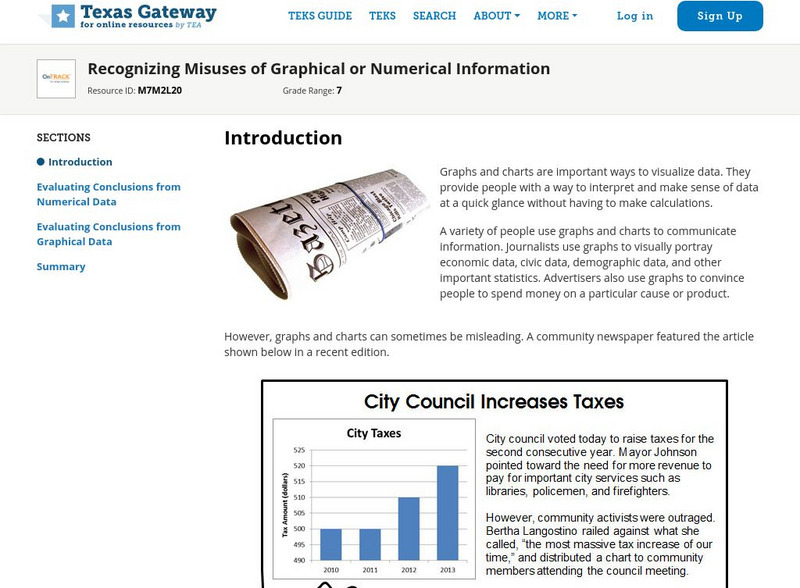
Texas Gateway: Recognizing Misuses of Graphical or Numerical Information
Given a problem situation, the student will analyze data presented in graphical or tabular form by evaluating the predictions and conclusions based on the information given.
National Council of Teachers of Mathematics
The Math Forum: Exploring Ocean Data Lesson Plan
Find "oceans of data" for students of all ages. NCTM, California, and Philadelphia standards are listed for each grade level along with lesson plans and other website resources.
Center for Innovation in Engineering and Science Education, Stevens Institute of Technology
Ciese Collaborative Projects: International Boiling Point Project
An Internet project designed to determine the greatest influence on the boiling point. After reading the project instructions and performing the experiment, submit your data and compare your results to other classes from around the world.
PBS
Pbs Learning Media: Water Resource Issues
Students learn about water management challenges. They will hear from water specialists and analyze data concerning the availability and environmental impact of the use of water. They will make an evidence-based argument that supports...
PBS
Pbs Learning Media: The Challenges of Making Peace: The Great War
For this interactive lesson, students watch videos from AMERICAN EXPERIENCE: The Great War, read primary source documents and video transcripts, and analyze data to better understand how and why the U.S. and European leaders differed in...
Texas Instruments
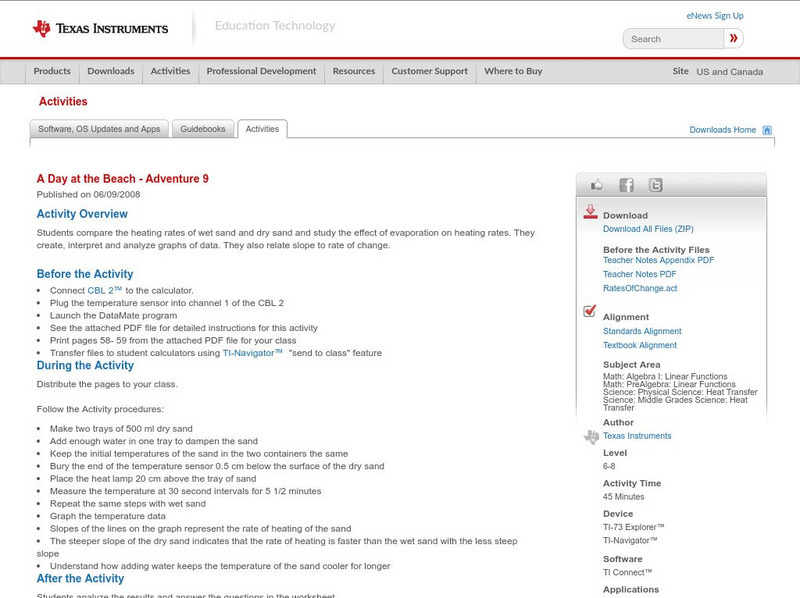
Texas Instruments: A Day at the Beach Adventure 9
Students compare the heating rates of wet sand and dry sand and study the effect of evaporation on heating rates. They create, interpret and analyze graphs of data. They also relate slope to rate of change.
Beacon Learning Center
Beacon Learning Center: All That Data 2
Students describe graphs and explore range, measures of central tendency, and distribution in this interactive web lesson.
Beacon Learning Center
Beacon Learning Center: All That Data
Students analyze data by finding the mean, median, mode, and range of a set of numbers. Line plots, bar graphs, and circle graphs are also included in this lesson.
Beacon Learning Center
Beacon Learning Center: Arrange a Party
Students use problem solving skills to calculate the range for a set of data and plan a party for friends.
Beacon Learning Center
Beacon Learning Center: Bicycles a La Mode
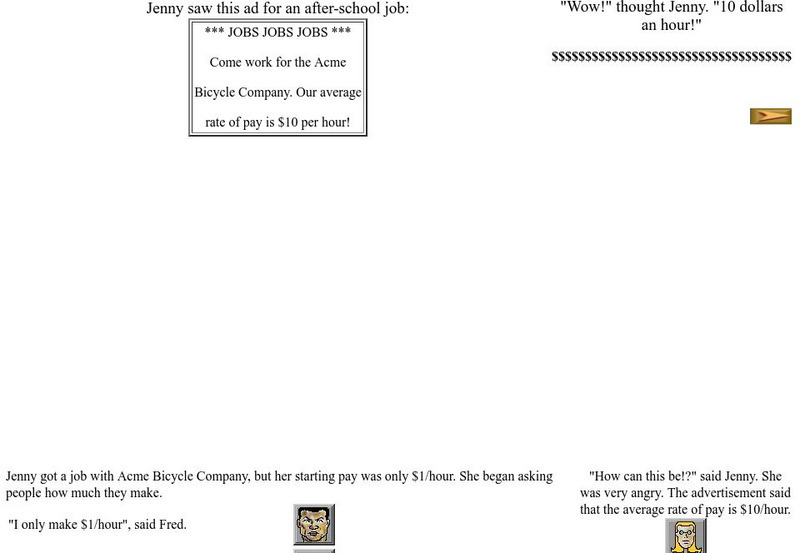
This lesson explores how the mode can be used to analyze data. Learning exercises are provided for students to practice the skill.
PBS
Pbs Mathline Lesson Plan: Struts'n Stuff [Pdf]
Incorporating concepts in algebra, number sense, patterning, data collection, and geometry, this lesson engages students in various hands-on activities to explore the relationship between regular polygons and the number of diagonals...
Other
Raymond Geddes and Company, Inc.: Analyzing Product Price and Sales Data
Lesson plan provides a real-world application of mean, median, mode, and range.
Centers for Disease Control and Prevention
Centers for Disease Control: Bam! Body & Mind: Teacher's Corner: Collect & Analyze Safety Data
Students explore facts and figures for causes of injuries and deaths of children their age by conducting a classroom survey and analyzing the data. Students learn about different kinds of health data collected by the government, and...
Beacon Learning Center
Beacon Learning Center: Basketball Means
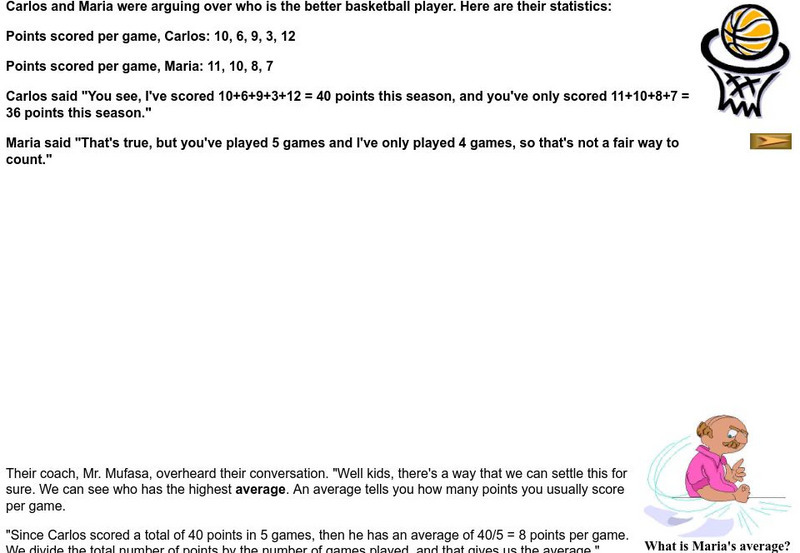
Students explore and practice calculating averages in this interactive web lesson.
Other
Pre K Pages: Question of the Day Graphing Activities for Preschool, Pre K, and K
A question of the day is a graphing activity that can be used to teach young children in preschool or kindergarten how to collect and organize data in a graphic representation as well as teach them how to analyze the data. This site...
Alabama Learning Exchange
Alex: The Mean, Median, and Mode Chain Gang
Cooperative learning groups and chain links are used to find the mean, median, and mode. A Science NetLinks lesson is linked for further real-life application in the world of baseball (optional). This lesson plan was created as a result...
National Council of Teachers of Mathematics
Nctm: Figure This: Does It Make a Difference Where You Shop?
A math investigation that uses scatter plots to compare prices of favorite soft drinks. Discover how valuable your skills in organizing and displaying data can be in real life scenarios.
McGraw Hill
Glencoe: Using Graphs to Understand Data Quiz
This is a quiz with five quick questions to check your knowledge of how to use graphs to understand data. It is self-checking.
McGraw Hill
Glencoe: Interpreting Data Quiz
This is a quiz with five quick questions to check your understanding of how to interpret data. It is self checking.
McGraw Hill
Glencoe: Collecting and Analyzing Data Quiz
This site is a quiz with five quick questions to check your understanding of how to collect and analyze data. It is self checking.


