Center for Innovation in Engineering and Science Education, Stevens Institute of Technology
Ciese: Collaborative Projects
Using a variety of science topics, these projects link your class with classes around the world in data collection and analysis. There are projects recommended for all grade levels. Begin dates and end dates are listed to help in...
University Corporation for Atmospheric Research
Ucar: Project Sky Math
Teachers will be interested to explore the SkyMath module, and the 16 classroom activities at this site. For this program, students will collect and record real-time weather data to analyze. Data analysis, graphing, number relationship,...
Other
Science Fair Primer: Reporting the Results
A good explanation of the elements of a good science fair report written by a high school science teacher. Details are given step by step on stating the hypothesis, explaining the experimental procedure, presenting the data attained, and...
National Center for Ecological Analysis and Synthesis, University of California Santa Barbara
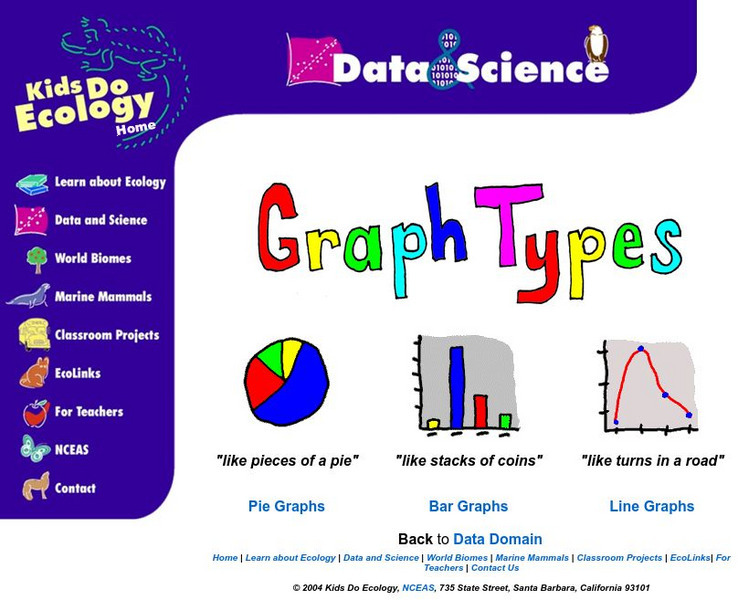
Nceas: Graph Types
At this site from NCEAS you can learn how to organize your data into pie graphs, bar graphs, and line graphs. Explanations and examples are given of each graph along with several questions that check comprehension.
Rice University
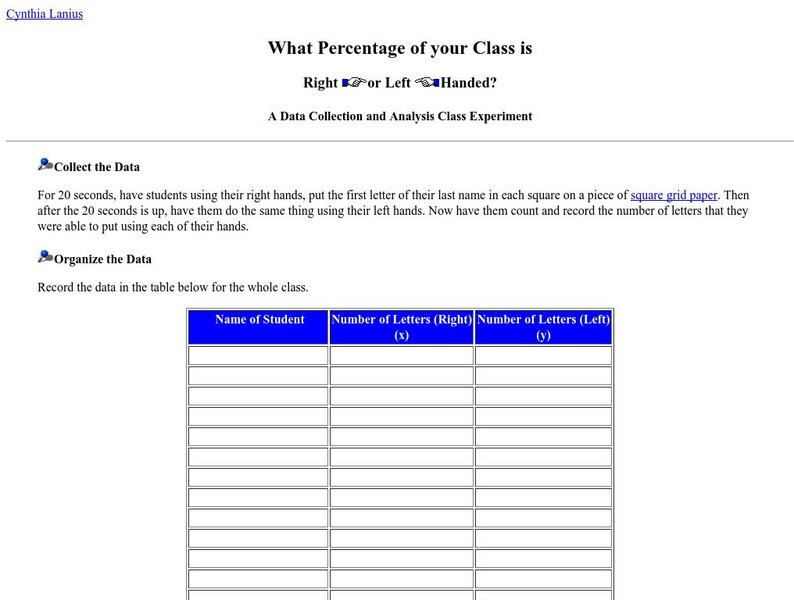
What Percentage of Your Class Is Right or Left Handed?
What percentage of the class is right or left-handed? Students will investigate this question using statistical processes of collecting the data, organizing it, graphing, and finally analyzing it. Follow-up questions are provided for the...


