Curated OER
Modeling the Keeling Curve with Excel
In this modeling the Keeling Curve learning exercise, students use given data beginning in 1960 to create a mathematical model for the changes in atmospheric carbon dioxide over time. Students manipulate the equation to predict the...
Curated OER
A Simple Model for Atmospheric Carbon Dioxide
In this atmospheric carbon dioxide instructional activity, students use two diagrams to solve 6 problems about atmospheric carbon dioxide. One diagram shows the Keeling Curve and the other shows sources of carbon and the natural and...
Curated OER
Carbon Dioxide Increases
In this atmospheric carbon dioxide learning exercise, learners use a graph of the Keeling Curve showing the increase in atmospheric carbon dioxide since 1958 to solve 6 problems. They determine the rate of increase, the find the...
Curated OER
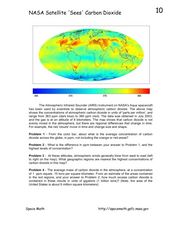
NASA Satellite 'Sees' Carbon Dioxide
In this atmospheric carbon dioxide activity, students observe a map showing the concentrations of atmospheric carbon dioxide taken by the Atmospheric Infrared Sounder instrument. Students solve 4 problems using the map. They determine...
Curated OER
Comparing Trends in Global Temperature to Global CO2 Levels
Students examine CO2 atmospheric levels. For this atmospheric lesson, students examine the correlation between CO2 levels and global warming.
Georgia Department of Education
Ga Virtual Learning: Air, Atmosphere, and Climate Change
Sixteen essential questions lead student learning about Earth's atmosphere and global warming as they have to do with global climate change.
National Geographic
National Geographic: Interactions Within Earth's Atmospheres
Using computational models, students investigate the interaction between greenhouse gases, solar radiation, and the Earth's surface for the impact on climate. They then look at data on atmospheric carbon dioxide to analyze changes in...
National Geographic
National Geographic: Sources, Sinks, and Feedbacks
Students will learn about how the Earth's carbon cycle works, as they examine the relationship between levels of carbon dioxide and water vapor in the atmosphere and the temperature of the ocean's surface. Includes online student...
NASA
Nasa: Why Is Carbon Important?
Students explore the relationship between atmospheric carbon dioxide concentrations and temperature, and how these relate to climate change. Graph and map data are used as evidence to support the scientific claims they develop through...
Climate Literacy
Clean: Stabilization Wedges Game
A team-based exercise that teaches players about the scope of the greenhouse gas problem, plus technologies that already exist to dramatically reduce our carbon emissions and help steer Earth away from climate change.
PBS
Pbs Learning Media: Global Climate Change: The Effects of Global Warming
Students conduct an investigation to determine CO2 levels in four different gas samples, examine evidence of global warming in our environment, and consider their own role in contributing to global warming.
Science Education Resource Center at Carleton College
Serc: Carbon Temperature Model
With this carbon/temperature interactive model, students investigate the role of atmospheric carbon in the greenhouse effect using a relationship between atmospheric carbon dioxide and global temperature.
NASA
Space Math: Nasa Satellite "Sees" Carbon Dioxide [Pdf]
Using this map from NASA you can calculate the concentrations of carbon dioxide in the atmosphere. Solve the four problems and you will see how concentrations are spread across the globe and where there are regional differences.
Climate Literacy
Clean: Greenhouse Gas in a Bottle Demonstration
A simple demonstration that is quick and easy to setup and provides dramatic evidence of the effect on temperature of an atmosphere with increased carbon dioxide. [4 min]
Science Education Resource Center at Carleton College
Serc: From Grid to Home
Students analyze energy use, cost, and source patterns from household to regional scales and relate these patterns to CO2 emissions.
NOAA
Noaa: Ocean Explorer: Off Base Acidity of Oceans
A student inquiry into properties of the ocean's carbonate buffer system, and how changes in atmospheric carbon dioxide levels may affect ocean pH and biological organisms that depend on calcification.


