Curated OER
Narnia Bar Charts
Here is a fabulous presentation that combines math and literature. Learners construct bar charts and frequency charts about things that happen in Narnia. Student pairs are assigned tasks regarding the variety of characters found in the...
Curated OER
How Soluble Is It?
Is sugar more soluble than salt? Experiment with water and solubility with an elementary science activity. After interpreting data from a bar chart, fifth graders use different types of sugar to determine if the size of sugar particles...
Curated OER
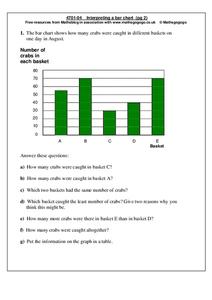
Interpreting a bar chart
In this bar chart worksheet, students analyze a bar chart and answer 7 questions pertaining to the information on the chart. The answers are on the second page.
Curated OER
Interpreting a Bar Chart
In this interpreting bar charts worksheet, students examine a bar chart that shows how many people traveled on boats that took them out dolphin watching. They answer 8 questions about the times and number of people on the boats.
Curated OER
Collecting Data
In this data collection worksheet, students read about how data is collected and organized. They also learn about a hypothesis. Students read through examples of different charts and then answer 23 questions pertaining to data...
Curated OER
Bar Charts and Pictographs: How can they help us?
First graders work with manipulatives to solve various math problems by using concrete objects to solve a list of problems . They create and evaluate bar graphs and write a statement about the information on their bar graph.
Curated OER
Pet Count Excel Graphing
Students used collected data to distinguish what pets they have or would like to have. They correlate findings with appropriate technology--Excel. At the end of the lesson they tabulate a bar chart and present their findings to the class.
Mangahigh
Mangahigh: Data: Using Bar Charts
This site provides students practice with the concept of bar charts. Students can learn about the topic by completing an interactive tutorial. Students can then take a ten question timed test to practice the skill.
CK-12 Foundation
Ck 12: Statistics: Double Bar Graphs Grades 9 10
[Free Registration/Login may be required to access all resource tools.] Covers double bar graphs.
Texas Instruments
Texas Instruments: Describing Categorical Data Advanced Placement
Students categorize data using tables and bar charts. They also determine relative frequencies.
BBC
Bbc: Representing Data
This BBC Math Bite tutorial for line graphs, pictograms, and frequency polygons features an exam in which students draw and interpret statistical diagrams.
Scholastic
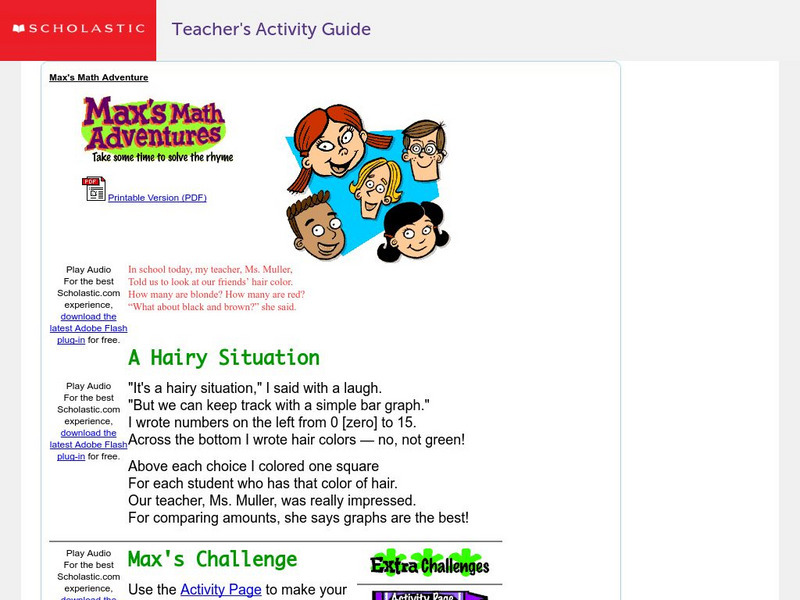
Scholastic: Max's Math Adventures: A Hairy Situation
Help Max make a bar graph to show the hair colors of his classmates. Teachers will appreciate the activities with bar graphs in the extra challenges. Use the teacher's guide to create a fun and engaging lesson.
University of Cambridge
University of Cambridge: Nrich: The Pet Graph
On this one-page website, sharpen your logic and graph reading skills by figuring out which pet goes with each bar on the graph. The solution is available to double check your own solution.
Wolfram Research
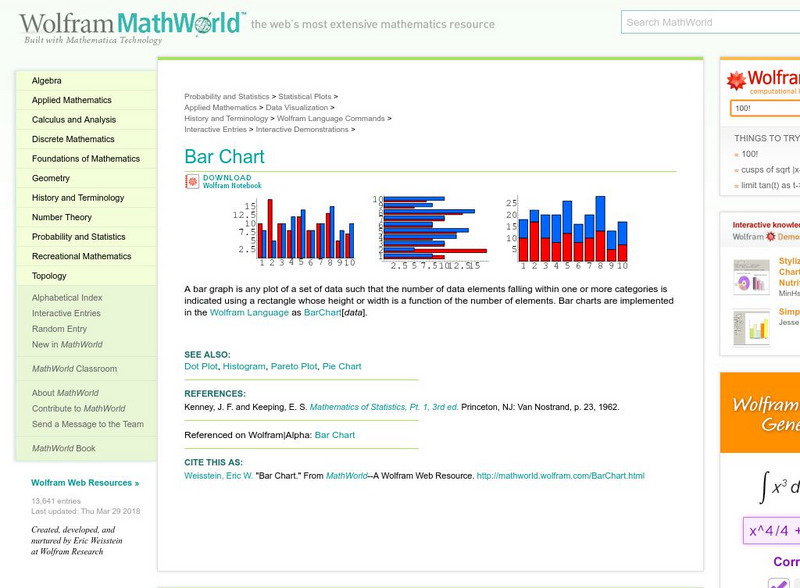
Wolfram Math World: Bar Chart
MathWorld offers a definition and example of the math term, "bar chart."
Education Place
Houghton Mifflin: Eduplace: Make a Living Bar Graph
Student use simple data to line up in a living bar graph activity when they respond to simple questions in this lesson plan. They physically and visually represent the data. CCSS.Math.Content.3.MD.B.3 Draw a scaled picture graph and a...
University of Illinois
University of Illinois: Bar Graphs
Two bar graph examples are shown and explained at this website. You can learn what kind of data is best represented using a bar graph.
Science and Mathematics Initiative for Learning Enhancement (SMILE)
Smile: To Classify Beans and Peas (Lesson Plan)
This site provides a lesson plan in which students learn about bar graphs by classifying beans.


