Curated OER
Coordinates 1
In this math worksheet, students fill in a chart by determining the location of different shapes on a coordinate system. Students are reminded to crawl (x-axis) before they climb (y-axis).
Curated OER
Position and Time Graphs
A series of graphs are displayed with points plotted for time and position. A question is asked for each, requiring your class to view one axis and track its partner coordinate. A few examples are given to begin each section, and so this...
Curated OER
Slope, Vectors, and Wind Pressure
A hands-on instructional activity using the TI-CBR Motion Detector to provide information to graph and analyze. The class uses this information to calculate the slope of motion graphs and differentiate scalar and vector quantities. There...
Curated OER
Applications of the Pythagorean Theorem - Magnetism
Middle and high schoolers use the Pythagorean Theorem to complete a table showing with the magnetic field strengths in given cities. They find the average value of the Earth's magnetic field and plot one of the three-dimensional values...
Curated OER
Dilations and Similarity
For this dilations and similarity worksheet, pupils solve 10 different problems that include various dilations. First, they determine the scale factor of dilations found in the illustrated graphs. Then, everyone determines the...
Curated OER
Coordinates
For beginning point plotters, these graphs give a good introduction. They examine a graph with shapes drawn onto it and each vertex labeled. There are 20 total, and scholars write the coordinates of each labeled point. All of these are...
Curated OER
Easter Graphing Fun
Graphing can be festive! This Easter worksheet has scholars using coordinates to record the location of ten holiday images. The first is done for them, and the grid is large and appealing to younger learners. Consider visualizing this...
Curated OER
Dilations with Matrices
Examine dilation with matrices with your class. Learners write a conjecture for how the scale factor determines the size of an image. They then use their conjecture to write a matrix multiplication problem for the illustrated...
Curated OER
Slope of a Line
In this slope of a line worksheet, students solve and graph 2 different problems that include determining the slope of a line using the equation y=mx+b. First, they define the slope of a line and the y-intercept. Then, students use the...
Curated OER
Matrix Madness!!
Perform operations to add, subtract, multiply and divide matrices. Then solve problems with vectors using matrices. A three day lesson: Matrix Madness, Mystical Matrices, and Decode the Encode. The last lesson has prizes that the class...
Alabama Learning Exchange
Coordinate Geometry
Where do the coordinates lead? As children brainstorm ways to find the location of different buildings, they learn about coordinate points and how to use them to locate areas on a grid or map. They practice using ordered pairs by playing...
Curated OER
Let's Plot Points
Use coordinate grid paper to plot points and identify shapes that are already plotted on the paper by saying their coordinates. Pupils also measure the distance between points and play the game Battleship. There are several web links and...
Curated OER
Graphing Greenery
Students gather leaves and trace them on graph paper. They plot coordinates that approximate the shape of the leaves and share those coordinates as "worksheets" for other students to complete.
Curated OER
The Unit Circle
In this unit circle worksheet, students measure angles in circles and label each point in the amount of degrees, or radian measurement. They measure and label 36 angles located in three circles.
Curated OER
Six Exercise Sets on Transformations
Middle and high schoolers solve fifteen problems from six exercise sets covering transformations, reflections, rotations, and enlargements. The solutions are provided.
Curated OER
Fishing for Points
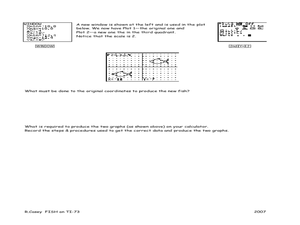
Learners explore the concept of ordered pairs. In this ordered pairs lesson plan, pupils list the ordered pairs of a graph in the shape of a fish. They use their calculator to translate the fish using lists, then translate the fish left,...
Curated OER
Challenge: Graphing Functions
Here is a functions worksheet in which learners solve functions containing variables, graph the coordinates, and answer two questions about it. They complete 14 functions.
Curated OER
7th Grade Math Worksheet
In this integers worksheet, 7th graders solve 10 different problems that include various types of integers and graphs. First, they determine the sum of 3 consecutive integers. Then, students find the ratio between 2 areas of similar...
Curated OER
All Kinds of Hats Graphing Fun
Where are the hats located? A graphing activity has mathematicians finding coordinates to give exact locations of ten hats scattered on a grid. An example is done for them. Consider showing learners this skill by putting hats around...
Curated OER
Coordinates on a Shower Curtain: Math
Learners use a shower curtain to represent a coordinate plane and then physically demonstrate their understanding or ordered pairs as they move from place to place.
Curated OER
Twenty-Seven Graphing Lines, Parabolas, and Absolute Value Problems
Have learners find coordinates of point on a graph, find equations of graphs given, and graph given equations using in and out tables. There are 27 problems related to equations for lines, parabolas, and absolute value functions.
Curated OER
Coordinates Counting Game
In this coordinates worksheet, learners play a game where they call out the coordinates and have to describe the picture in the coordinate box. Students complete 16 problems.
Curated OER
Graphing
In this graphing worksheet, students solve and graph 10 different problems that include determining various coordinates and the slope. First, they use the table to write the x and y coordinates for each point on the graphs. Then,...
Curated OER
Graphing
In this graphing worksheet, 5th graders identify and graph 20 different problems on the 3 different graphs shown on the sheet. First, they use the tally of callers organized by the school to complete the three different types of graphs....


