Curated OER
How Long Can You Go?
Eighth graders examine the usefulness of a line of best fit by collecting and graphing data, using a graphing calculator to determine the line of best fit, and making a variety of predictions. They watch a video, then design a...
TeachEngineering
Teach Engineering: The Challenge Question: "Walk the Line"
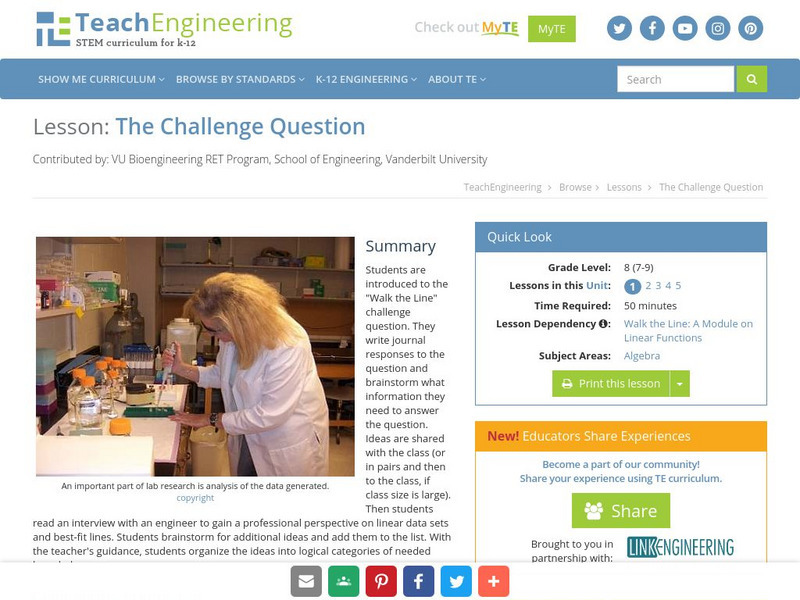
Students are introduced to the "Walk the Line" challenge question. They are asked to write journal responses to the question and brainstorm what information they need to answer the question. Ideas are shared with the class (or in pairs...
University of Kentucky
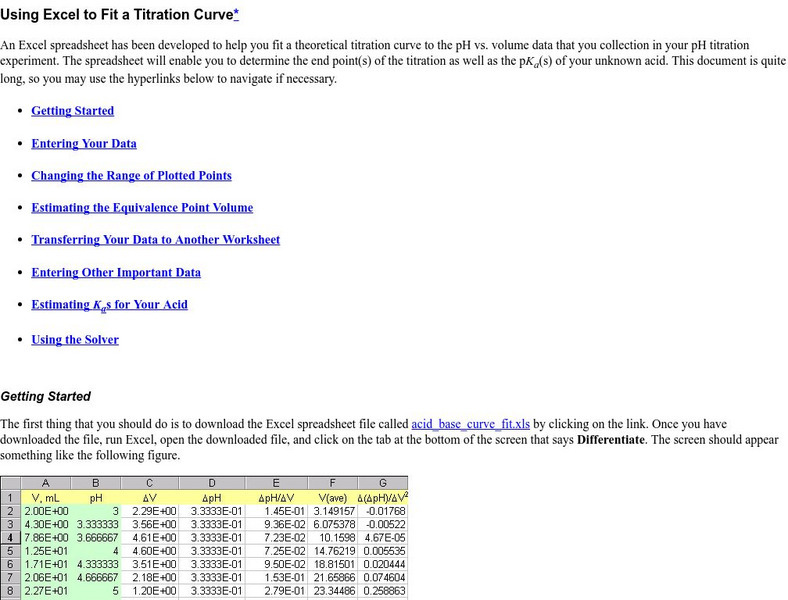
Univ. Of Kentucky: Using Excel to Fit a Titration Curve
This site from the University of Kentucky provides instructions on using a spreadsheet to plot a best-fit titration curve.
Texas Instruments
Texas Instruments: Trying to Find a 'Best' Fit a Heuristic Approach
In this Derive activity, students determine the optimal location for a warehouse so that it is close to the center of a circle that passes through all the outlets of a store in the region.
Texas Instruments
Texas Instruments: Trying to Find a Best Fit: Heuristic Approach
In this activity, students can use geometry to determine the optimal location for a distribution warehouse of a department store chain.
University of Arizona
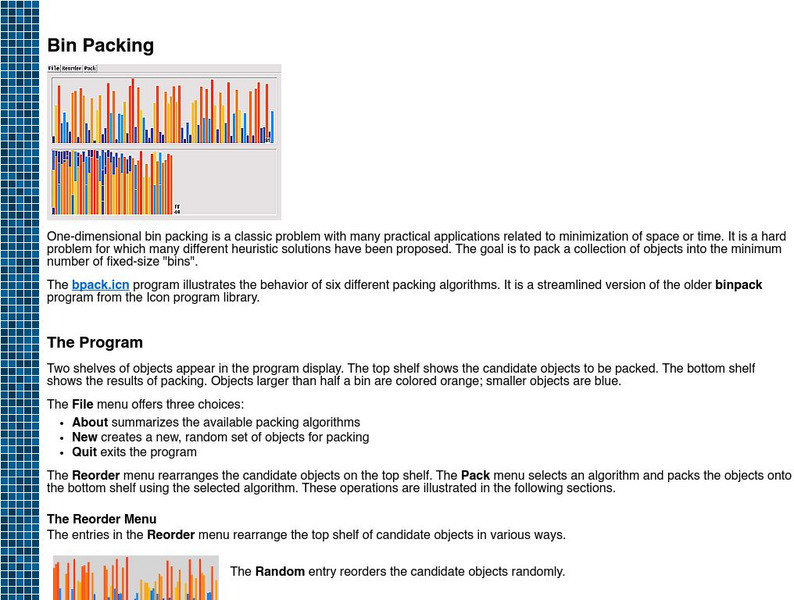
Bin Packing Program
This is actually an overview of a program that is available to maximize bin packing, but it gives a good view of how bin packing is used and how to use it effectively.
CK-12 Foundation
Ck 12: Statistics: Scatter Plots on the Graphing Calculator
[Free Registration/Login may be required to access all resource tools.] This lesson covers finding the equation of best fit using a graphing calculator.
Other
American Mathematical Society: Bin Packing
Bin packing is a very appealing mathematical model. This article discusses several bin packing problems and the various methods for solving them.


