Curated OER
Traveling Nitrogen
Students demonstrate and understanding of the nitrogen cycle by taking roles and interacting with others in a simulation activity.
Curated OER
Urban Changes
Students explore how landscapes undergo constant changes with urban development. They plan and build their own "city" by including features that have minimal resource demands to sustain the city itself.
Curated OER
Our Universe: Designed or Evolved?
Students brainstorm and write arguments for Evolution and Intelligent Design. They research the history of each of these ideas. They also examine the controversy of teaching one or both ideas in schools.
Curated OER
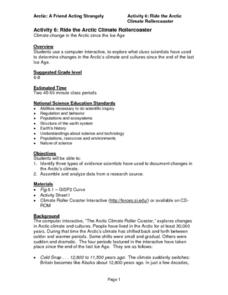
Ride the Arctic Climate Rollercoaster
Students view interactive CD-ROM entitled The Arctic Climate Roller Coaster, research evidence of changes in climate through the years, record ways people responded to changes, and create short presentations to share evidence with...
Curated OER
Formation of Rain
Students sequence the steps leading to the formation of rain, and design a model to represent these steps. This task assesses students' abilities to classify, generalize, infer, interpret and communicate data, and construct a pictorial...
Curated OER
Water Pollution
Students study four samples of "rain water". They asked to determine the pH of the samples and then to neutralize them. Students are asked to predict any negative effects which might be associated with water having a low pH and to...
Curated OER
What's the Connection Between Convection and Inversion?
Ninth graders observe a simulation demonstrating the difference between convection and inversion. They explain where and when convection and inversion layers occur and how each impacts air quality, and by connection, human health.
Curated OER
Reflection and Absorption of Light
Students use a microcomputer connected to a light sensor and temperature probe to explore the reflection and absorption of radiation for different surfaces. Students follow instructions in this guided inquiry based lab and are then asked...
Curated OER
Hurricanes and Climate
Students investigate maps and data to learn about the connections between hurricanes and climate. In this exploratory lesson students describe and graph the 6 regions where hurricanes happen and discuss how hurricanes have changed over...
Curated OER
Twister: The Tornado Story
Students examine dangerous weather by researching tornadoes. In this extreme weather lesson, students identify the states included in Tornado Alley. Students create a virtual tornado using 2 plastic bottles.
Curated OER
Filling Up Florida
Students study factors controlling Florida's population growth and related environmental impacts. They research natural community types and construct maps (including a large-sized map of Florida) to be used for a simulation activity.
Curated OER
What Can I Do About Global Environmental Change?
Students complete a unit to evaluate their impact on the environment and greenhouse gas emissions. They conduct Internet research, develop a list of their electrical and energy use, calculate their share of greenhouse gases, and identify...
Curated OER
What Is In The Water?
Students investigate the biotic and abiotic factors that are found in an aquatic ecosystem. The emphasis is upon the investigation of present an projections of future water quality. Then students visit a local body of water to gather...
Curated OER
Roots of the World
Students recognize consist stems, trunks, leaves, and roots. They compare different types of roots by observing and comparing photographs. Aterwards, they observe the growth of a lima bean plant and document changes in root and shoot...
Curated OER
How Wet Did It Get?
Students measure the rainfall/snowfall on the playground on a rainy/snowy day with a rain/snow gauge. They draw a bar graph representing the amount of water that fell and observe a satellite image of the clouds and local weather system...
Curated OER
The Rock Cycle Graphically Organized
Fourth graders use the prereading strategy of discussion and then use a graphic organizer to help guide reading on the topic of the rock cycle. They use a worksheet imbedded in this plan to guide thier inquiry.
Curated OER
Environment: Just Around the Bend
Students decipher landforms on a map and corresponding satellite imagery. They consider the impact of pollution on agriculture and water. They draw diagrams demonstrating how pollution works its way into the food source.
Curated OER
Understanding Groundwater & the Effects of Pollution
Students complete a unit on the effects of pollution on our water supply. They create a graph to examine the density of earth's land surface, round the population to the nearest hundred million place, participate in a...
Curated OER
Painting the Hallway with Pixels
Students create science design to be painted on the wall in the hallway of the science area of the school building. They measure space available, make a scale model of the design, and paint different pixels.
Curated OER
Eyewitnesses to Change
Students explore recent changes in the Artic's climate that have been observed by Artic residents. They watch videos, take notes and create a concept map. They also look at historical weather data from a specific Artic community. The...
Curated OER
Ocean Botttom Profile
Students interpret a graph of ocean depths and topographic features. This task assesses students' abilities to interpret figures, organize and represent data, apply knowledge of scale to a profile, and apply theoretical knowledge.
Curated OER
The Blizzard of 1993
Students read and interpret the information from a barograph from a major winter storm. This task assesses students' abilities to interpret and analyze graphs, construct data tables and graphs, generalize, infer, apply knowledge of...
Curated OER
Formation of Wind
Students correctly sequence the steps leading to the formation of wind, and describe the cause and effect relationships involved in the formation of wind. This task assesses students' abilities to classify, generalize, infer, interpret...
Curated OER
Locating Vent Fields Using CTD Data
Students describe the way hydrothermal vents work. Students work on locating vent regions through remote collection of data about water temperature and density. Comparing density and temperatures graphs, students search for indicators...
Other popular searches
- Earth System Origins
- 4 Major Earth Systems
- Moon Earth System
- Earth Systems Unit
- Major Earth Systems
- Earth Systems Interactions
- Sun Earth Moon System
- Earth Systems Global Winds
- Earth Systems 3209
- Earth Systems Science
- Earth Systems and Patterns
- Earth System Atmosphere


