Curated OER
Measuring Rainfall and Relationships Between pH, Alkalinity and Suspended Solids in the Pago River
Eleventh graders test the pH and alkalinity of Pago River. In this ecology lesson, 11th graders collect data and use spreadsheet to graph results. They analyze and share their findings with the class.
Curated OER
Acids and Bases: Their Reactions, Conductivity, Base Indicators and Neutralization Reaction
Learners conduct experiments and collect data to determine physical and chemical characteristics of acids and bases.
Curated OER
Levers
Fifth graders participate in a review discussion of the parts of a lever, resistance or load, fulcrum, and effort. Next, they complete activities at six experiment stations while collecting data that they share with the class. While...
Curated OER
Designing An Investigation
Students will design a scientific investigation. In this engineering design lesson, students will set up an investigation, collect data and form a conclusion about bridge design. They will use common household items to construct their...
Curated OER
EarthTrek Gravestone Project
Students explore the effects of acid rain. In this acid rain lesson, students investigate the effects of the weathering from acid rain in different places. Students visit cemetaries to collect data about the effects of acid rain on the...
Curated OER
Radiation and Color
Tenth graders explore the relationship between color and heat absorption by measuring the temperature change of water in differently colored test tubes as they are exposed to a heat lamp. They work in small groups to collect data and...
Curated OER
Math: Graphs and Their Symbols
Second graders examine different types of graphs and discover the meanings of the symbols used on them. After gathering data about themselves, their communities, and the world, they use that information to create graphs. Among the...
Curated OER
Graphing and Analyzing Biome Data
Students explore biome data. In this world geography and weather data analysis instructional activity, students record data about weather conditions in North Carolina, Las Vegas, and Brazil. Students convert Fahrenheit degrees to Celsius...
Curated OER
Excel temperature Graphs
Students gather data about the weather in Nome, Alaska. In this Nome Temperature lesson, students create an excel graph to explore the weather trends in Nome. Students will find the average weather and add a trend line to their graph.
Curated OER
Monopoly Graphs
Students relate the concepts of linear functions to the game of monopoly. In this algebra lesson plan, students solve problems with ratio and proportion. They collect data and graph it.
Curated OER
Environmental Issues in Multimedia Presentation
Students investigate a community environmental issue. They document it using traditional scientific methods, digital photography, and videotaping. After collecting data, they graph the results. Students present their findings in a...
Alabama Learning Exchange (ALEX)
Lost in Space - A Solar System Study
Fourth graders study the planets of our Solar System collecting data on a worksheet. They use online tools to create a puzzle or other digital product using the information from their research.
NASA
Benford's Law
In this Benford's Law learning exercise, high schoolers read about the first digit frequency of numbers. High schoolers solve 3 problems about sunspot numbers, solar wind magnetism and the depth of the latest earthquakes by using on line...
Curated OER
Beginning Graphs in MS Excel
Students practice creating graphs in Microsoft Excel. In this technology instructional activity, students conduct a random survey and collect data. Students use the Microsoft Excel program to create a bar graph of the data.
Curated OER
Exploring Diameter and Circumference
Learn how to identify the diameter and circumference of a circle. Then, collect data on a circle and relate it to the diameter and circumference of a circle. Last, plot data and find the line of best fit.
Curated OER
Mosquito Life Cycle
Seventh graders investigate the life cycle of the mosquito. In this life cycle instructional activity, 7th graders gain knowledge about the diseases mosquitos carry. Students breed mosquitos and investigate their eggs. Students collect...
Curated OER
Trajectory Perplexity
Students investigate measuring angles correctly through projectiles. In this geometry lesson, students launch a projectile to investigate the importance of how to measure an angle correctly and to explore trajectory. They collect data...
Curated OER
Designing a Study
Students explore features to consider when designing a scientific study. In this science research lesson, students examine different methods of data collection and consider which method would be appropriate for determining how many types...
Curated OER
Sports Data for the Classroom
In this algebra activity,students rewrite word problems using algebraic expressions. They collect data and plot their findings on the graph and analyze it. There is an answer key for this activity.
Curated OER
Organizing Data
In this statistics worksheet, 11th graders collect data and organize it using a frequency table. They plot their data and analyze it using stem and leaf plots. There are 3 questions with an answer key.
Curated OER
Scientific Problem Solving
In this problem solving worksheet, students will conduct an experiment to answer this question: "How does watching too much television affect us?" Students will form a hypothesis, collect data, analyze their data, and draw a conclusion....
Curated OER
Graphs
Students explore graphs and define the different ways they are used to display data. In this algebra lesson, students collect data and plot their data using the correct graph. They draw conclusions from their graphs based on their data.
Curated OER
Square Foot Garden
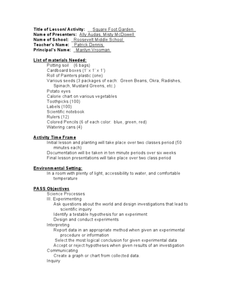
Students plant a garden and keep track of it. In this geometrical garden lesson plan, students collect data from their garden twice a week. They graph their finding and figure out how many square feet of growing space each person needs...
Curated OER
Energy Efficient Homes
Students observe and gather data from a model simulated home. In this efficiency lesson students examine the factors that influence energy efficiency, complete a lab activity then draw conclusions from their data.
Other popular searches
- Collecting and Recording Data
- Data Collection Techniques
- Math Lessons Data Collection
- Data Collection Activity
- Data Collection and Median
- Data Collection and Graphs
- Data Collection Projects
- Data Collection and Analysis
- Accurate Data Collection
- Data Collection Lesson Plans
- Experimental Data Collection
- Collection of Data


