Curated OER
Comparing Data
Eighth graders create a survey, gather data and describe the data using measures of central tendency (mean, median and mode) and spread (range, quartiles, and interquartile range). Students use these measures to interpret, compare and...
Curated OER
Leonardo da Vinci
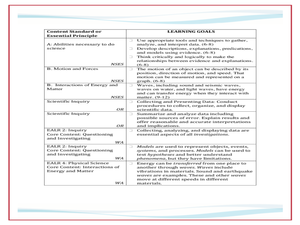
Students select appropriate tools and technology to perform tests, collect data, and display data. They construct appropriate graphs from data and develop qualitative statements about the relationships between variables.
Curated OER
Data Analysis and Probability Race to the Finish
Students practice addition facts, record data, and construct a bar graph. In this probability instructional activity, students participate in a board game in which bicycles move towards a finish line based on players completing addition...
Curated OER
The Phone Bill Problem
Students write an equation for a linear function. In this algebra lesson, students collect data, plot it and graph it. They identify the equation of the graphed data and define the slope and y-intercept of the graph.
Curated OER
Mean, Median, Mode and Range
Fourth graders investigate when to find the mean, median, mode and range. In this statistical concepts activity, 4th graders collect data, make observations and graph the data. Students verify their work on the computer.
Curated OER
Conditions at Sea Introductory Activity, Making Waves
Students explore waves and wind. In this physical and earth science wave lesson plan, students participate in a wave making activity with an aquarium and a hair dryer. Students complete a data chart recording wave height and related...
Curated OER
Cloudy with a Chance of........
Fourth graders watch a video about Utah's weather and illustrate the water cycle. They read "Cloudy with a Chance of Meatballs" and identify weather words after listening to the weather radio. They create weather measurement instruments...
Curated OER
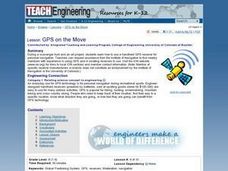
TE Lesson: GPS on the Move
Middle schoolers participate in a scavenger hunt and a drawing activity to examine the use of Global Positioning Systems including a handheld GPS receiver for personal navigation. They practice using the GPS receivers while collecting...
Curated OER
Prairie Restoration and Prairie Ecology
Students collect data as they identify and classify native prairie plants and insects. They create their own population study using a variety of sampling techniques to determine the population density of various species. Students...
Curated OER
Fire Safety Survey
Students collect data regarding fire safety and create a graph. Working in small groups, they administer a survey to family and friends regarding their attitudes toward fire safety. After data has been gathered, students graph their...
Curated OER
Solar Car Series: During what part of the day can t most Sun power be collected?
Students participate in an outdoor activity in which they make direct but safe observations of the Sun. Students use a solar cell and voltmeter apparatus to collect data on the amount of DC voltage produced by the solar cell during a...
Curated OER
Energy Content of Foods
Learners collect data, organize and analyze the data and compare it to real life scenarios. This assignment requires two class periods.
Curated OER
Let the River Run
Pupils examine deposits found in a river in this science lesson. They collect data of sediment deposit found in the Mississippi river, then graph and analyze their data using the TI.
Texas Instruments
Measuring Air Pressure Lab
Your class can investigate the weather through an experiment. In this chemistry lesson, learners collect data on air pressure and relate it to the weather. They collect data with the TI containing a barometer probe.
Curated OER
TI Workshop Presentation Guide for "Preparing for Proofs"
Pupils discover proofs using the TI in this geometry instructional activity. They collect data from newspaper and magazines and analyze their data using the TI, relating it to proofs.
Curated OER
Archaeology and Erosion
Sixth graders study how erosion affects archaeology sites. In this investigative lesson, 6th graders construct a model of a pyramid using sugar cubes. They will investigate in groups how water, wind, and sunlight affects their model...
Curated OER
Go Car, Go!
Students design and build their own car. In this physics lesson, students collect data to determine the speed of the car. They plot the data on the graph analyze the relationship between variables.
Curated OER
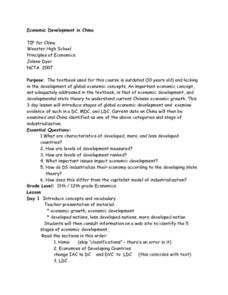
Economic Development in China
Young scholars create a poster which depicts and summarizes Rostow's 5 stages of economic development. They make a list of 8 data measures that help identify which level of economic development a country is at. They gather data...
Curated OER
Bubble Gum Physics
In this scientific method learning exercise, learners perform an experiment to determine the speed at which they can chew a piece of gum. They record data, calculate speed and answer reflection questions.
Curated OER
Making Connections-Review Experimental Design and Homeostasis
In this experimental design and homeostasis instructional activity, students complete 20 sentences with key terms about designing experiments, gathering data, graphing data and determining controls. They also complete sentences about...
Curated OER
Solubility Lab
In this solubility worksheet, students test a variety of polar and non polar substances to determine which ones will dissolve in vegetable oil and which ones will dissolve in water. Students collect data and answer 2 questions about...
Curated OER
The Lynx Eats The Hare
Students investigate the predator and prey relationship. This is done using a simple simulation. The simulation is done as an arts and craft activity. Students record data and track it using a graphic organizer and then they discuss the...
Curated OER
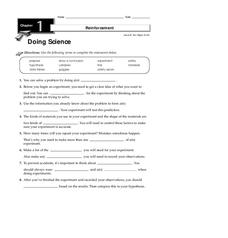
Doing Science
In this science experiment process activity, students will learn about the steps of conducting a science experiment, including creating a hypothesis, collecting data and drawing a conclusion. This activity has 8 fill in the blank...
Curated OER
Data Record Plant Observation
In this recording data worksheet, students draw and describe their observations of a plant on a chart. Students describe three observations.
Other popular searches
- Collecting and Recording Data
- Data Collection Techniques
- Math Lessons Data Collection
- Data Collection Activity
- Data Collection and Median
- Data Collection and Graphs
- Data Collection Projects
- Data Collection and Analysis
- Accurate Data Collection
- Data Collection Lesson Plans
- Experimental Data Collection
- Collection of Data


