Curated OER
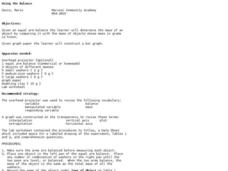
Using the Balance
Students determine the mass of various objects. In this integrated math and science lesson, students use an arm balance to compare a known object to a combination of washers with a fixed weight. Students record data, construct a bar...
Curated OER
Quantitative Data
In this algebra instructional activity, students collect data using tally marks. They then record their data, graph it and analyze it. There are 23 questions with an answer key.
Center for Innovation
Air Pollution: What's the Solution?
In this air pollution worksheet, students collect data for their county of residence as well as 10 surrounding counties including the total population and the county grade for the air. They use a map of their state and identify the 10...
Curated OER
Wreck Detectives
Students investigate shipwrecks. In this marine archaeology lesson ,students collect data and make inferences about the causes of shipwrecks. Students work in groups to create their own model of a shipwreck using clay. Students then...
Curated OER
Mean Median and Mode
Students collect data, graph it and analyze it. In this statistics lesson, students plot their data and calculate the mean, median and mode explaining how it relates to the data. They define the ways to find the mean, median and mode.
Curated OER
Graphing Surveys
Students collect data and graph it. In this algebra lesson plan, students create a survey for their classmates and teachers. They analyze the results from the survey and graph it. They draw conclusion from their data based on the graph.
Curated OER
Scatter Plots
Seventh graders investigate how to make and set up a scatter plot. In this statistics activity, 7th graders collect data and plot it. They analyze their data and discuss their results.
Curated OER
Probability and Expected Value
Students collect data and analyze it. In this statistics lesson, students make predictions using different outcomes of trials.
Curated OER
Inclined Plane and Pulley
Students describe how inclined plane and pulleys make work easier. In this physics lesson, students calculate work done and mechanical advantage of both simple machines. They collect data from the experiment and construct graphs.
Curated OER
Mammals: Mammals and Their Ways
Students, in groups, observe, collect data, and analyze mammal behaviors.
Curated OER
Measuring the Impact of Exercise And Body Position (laying Down, Sitting And Standing) on Heart Rate
Seventh graders gather data on heart rate during exercise and at rest in three different positions. They compute male and female averages for each different heart rate and graph each and draw conclusions based upon the data about the...
Curated OER
Deadly Shadow of Vesuvius
Students view a video clip about volcanoes. They collect data and create maps to see the relationship between volcanoes, earthquakes and plates. They share their maps with the class.
Curated OER
What Is the Nature of Science?
Students distinguish between scientific and everyday meanings of key words-theory, hypothesis, law, fact-and use in context. They recognize the variables that affect observation, data collection, and interpretation. They discover the...
Curated OER
Could There Be Cancer in My Classroom? Part II
Students collect and record data from a variety of web sites concerning cancer and treatment options. They examine a specific case study of a girl with cancer and determine what her treatment options might be.
Curated OER
Graphing
Young scholars investigate graphing. In this bar graph lesson, students view an informational website about graphing, then construct a class birthday bar graph outside with sidewalk chalk. Young scholars choose a survey topic, then...
Curated OER
Wildcat Dumping
Students design and print an educative pamphlet addressing Wildcat Dumping in their community by conducting research. They conduct a survey by investigating local occurrences of Wildcat Dumping and collecting data to share with the...
Curated OER
The Shapes of Flight
Students explore interaction between mathematics, science, and technology as they look at process of researching, developing, testing, and evaluating airplane design. They calculate glide ratio for model paper airplane by using data...
Curated OER
Black History Project
Third graders explore and analyze about famous African-Americans by listening to four picture book biographies. They generate a list of 15 famous African-Americans and then create a survey to rank them according to importance of...
Curated OER
A Place for the Birds
Students reflect on bird migrations and develop a project to collect data on bird species from across North America to further investigate the ranges and migrations of common birds. They create a field guide of North American birds.
Curated OER
Land Erosion - Does Vegetation Matter?
Young learners explore erosion, deposition, weather and climate in this science lesson plan. They discuss the cause of erosion, collect data and analyze it suing the TI Explorer. They can also use the TI CBL or Vernier LabPro for this...
Curated OER
Diatoms of Laboratory Indicators of Water Quality
In this science worksheet, learners use the diatoms present in water in order to test water quality and perform data collection and interpretation.
Curated OER
Tossing a Number Cube-- Tally Marks
In this math worksheet, students investigate probability by tossing a number cube 20 times and recording the times that it lands on each number. Tally marks are used to record data. Students then participate in an experiment in...
Curated OER
Formula of a Hydrate Lab
In this hydrate worksheet, students find the formula of an unknown salt by determining the mass of water in the heated compound. Students burn off the water and record data to establish the final mass and formula of the hydrate.
Curated OER
Don't Be a Square
Students analyze the relationship between radius and diameter. Students read Sir Cumference and the First Round Table then take measurements of circular items from around the room. Students compute the radius, diameter and...
Other popular searches
- Collecting and Recording Data
- Data Collection Techniques
- Math Lessons Data Collection
- Data Collection Activity
- Data Collection and Median
- Data Collection and Graphs
- Data Collection Projects
- Data Collection and Analysis
- Accurate Data Collection
- Data Collection Lesson Plans
- Experimental Data Collection
- Collection of Data


