Curated OER
Collecting Data
In this algebra activity, students collect and analyze data. They graph and identify their solutions. There is one question with an answer key.
Curated OER
Heads & Tails Data Collection
For this data collection worksheet, students use a penny and a dime to play a math game. Students flip the money in the cup and then record the number of heads and tails showing marking the coins in the box.
Curated OER
Ketchup to Collecting Data
First graders collect data for a survey of 3 brands of ketchup and create class charts. They taste test three different brands of ketchup, and use the data to create a presentation. Tasty lesson!
Curated OER
Data Collection
High schoolers investigate qualitative and quantitative data. For this statistics lesson, students gather data on heights and weights of people and graph the distribution. High schoolers discuss the differences between qualitative and...
Curated OER
Data Analysis and Froot Loops
Use this probability and graphing lesson to have your learners work with a partner to make a necklace out of Froot Loops. They record the cereal colors randomly chosen and strung, graph their data, then use a ratio formula to determine...
Virginia Department of Education
Exploring Statistics
Collect and analyze data to find out something interesting about classmates. Groups devise a statistical question and collect data from their group members. Individuals then create a display of their data and calculate descriptive...
Teach Engineering
Using Hooke's Law to Understand Materials
Provide a Hooke for a lesson on elasticity with an activity that has groups investigate a set of springs. They use a set procedure to collect data to calculate the spring constant for each spring using Hooke's Law. The groups predict the...
Curated OER
Are You Full of Hot Air?
Explore the concept of measuring and recording circumference. In this physical science and measurement lesson, young learners blow up balloons, measure the circumference, and record the data on an interactive graphing website.
Curated OER
The Golden Students
Scholars view the video, "Donald Duck in Mathmagic Land," and discuss examples in nature which have proportions of the golden ratio. They measure and record different body lengths from a worksheet and convert the ratios to equivalent...
Curated OER
That's Predictable - Stream Side Science
Research the impact that changes in biotic or abiotic factors might have on an ecosystem. Debate for or against the changes and take action in the community. This resource ideally follows stream studies that young ecologists may have...
Curated OER
Physical Science: Festival of Bubbles
Investigate bubbles through the use of scientific inquiry. Pupils blow bubbles using several methods and measure the resulting bubble print. Measurements are recorded on a data table and transferred to a bar graph. Results are discussed...
Radford University
Snappy Stair Sprints
Let's go for a run. Small groups determine a way to collect data to determine the time it would take to run a set of stairs. After creating a plan, teams collect data and graph their results, calculating the equation of best fit and...
Equality and Human Rights Commission
Learning area 4: Learn About the Meaning of Community
Scholars examine the jobs found in their community by way of surveying. After collecting data, pupils analyze their findings and share their observations with their peers. A video sparks interest. Two posters motivate participants to...
US Department of Commerce
Make Data Speak
Data displays are more than just a bunch of numbers. Small groups access census results and create eye-catching data displays. Teams choose a statistic and collect data points for five locations. Classmates present their infographics to...
Alabama Learning Exchange
Yummy Apples!
Young learners listen to a read aloud of Gail Gibbons book, Apples and the story A Red House With No Windows and No Doors. They compare characteristics of a number of kinds of apples, graph them and create a apple print picture. Learners...
Virginia Department of Education
Work and Power
Assist your class with correctly calculating the values for force, work, and power as they determine the amount various activities require. They gather data and participate in a group discussion to compare results upon conclusion of the...
Curated OER
Data Collection
Students explore the reason for collecting and analyzing facts and figures or data and statistics. They show how data can be used to help us to solve real life problems and plan for the future. Students use everyday problems that can be...
American Museum of Natural History
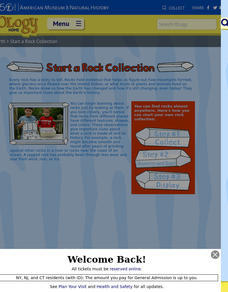
Start a Rock Collection
Rocks hold evidence of Earth's past. A three-step guide describes the process of creating a rock collection. It provides a data collection sheet to make notes about each sample.
Curated OER
Collecting Data and Graphing
Students practice collecting and graphing data using interlocking cubes. In this graphing instructional activity, partners count cubes and graph them. They also use a meter stick to measure arm span and height then compare the results...
Radford University
Animal Decline
Where did they all go? Small groups collect data on different animal species that are on a decline. Teams develop equations to model the populations over time and then create presentations about the decline of their animals. Classmates...
Radford University
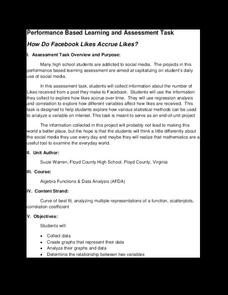
How Do Facebook Likes Accrue Likes?
Finally, a project pupils will instantly like! Young mathematicians collect data on the number of likes they receive for a social media post over time. During the first part of the project, they determine a curve of best fit and...
Radford University
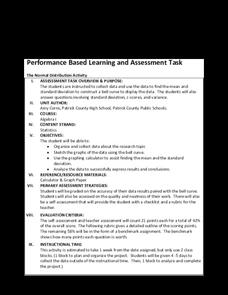
The Normal Distribution Activity
For whom does the bell fit? Pupils begin by working in groups gather data on three different variables. They then determine the mean and standard deviation of each data set and create bell curves. To finish, they answer guiding questions...
American Statistical Association
How Long Are the Words in the Gettysburg Address?
It's 268 words, but one only needs to consider 10 of them at a time. A data collection and analysis activity has learners investigate the lengths of words in the Gettysburg Address. They first self-select a sample of 10 words and...
Bowland
Fashionista
So trendy! Show your class how to identify trends in sales patterns using mathematics. Scholars use a software simulation to collect data on age groups, price, and sales at a fashion store. This data allows individuals to determine the...
Other popular searches
- Collecting and Recording Data
- Data Collection Techniques
- Math Lessons Data Collection
- Data Collection Activity
- Data Collection and Median
- Data Collection and Graphs
- Data Collection Projects
- Data Collection and Analysis
- Accurate Data Collection
- Data Collection Lesson Plans
- Experimental Data Collection
- Collection of Data


