Radford University
Discovering Quadratics
Get to know quadratics from a couple of different perspectives. Classmates work in small groups to determine the optimal cooking time for microwave popcorn. Group members pop bags of popcorn for different times and collect data on the...
American Statistical Association
Speedster
Catch me if you can. Scholars collect data on reaction time by catching a falling ruler or by using an Internet app. They determine the median of the data, create graphs, and analyze the results. They also compare their data to the rest...
Cornell Lab of Ornithology
Investigating Evidence
Explore the scientific process through nature. Scholars become scientists as they develop a question, design an experiment, collect data, and analyze their results. A two-week lesson guides your classes through the process and provides...
Radford University
Regression Analysis Activity
Don't let your knowledge of regression analysis regress. Pupils take part in three activities to learn about regression curves. They research and collect data to predict how long it will take a basketball to hit the ground, find a...
Radford University
How High Can You Throw?
Find heights by measuring time. Teams collect data to determine the height that a tennis ball is thrown. Classmates measure the height of the initial release of the ball and how long it stays aloft. Using a projectile motion equation,...
Curated OER
Data Collection
Students write a journal exercise that relates to pets. They collect information from each other in order to practice making and interpreting bar graphs. They Continue building different kinds of graphs with the group.
Curated OER
ABC Data Sheet
Ever wonder why your special-needs or autistic learners have out bursts in class? Use this ABC Data collection sheet to determine the antecedent, behavior, and consequence to help you determine a possible function for your student's...
Illustrative Mathematics
Weather Graph Data
Teaching young mathematicians about collecting and analyzing data allows for a variety of fun and engaging activities. Here, children observe the weather every day for a month, recording their observations in the form of a bar graph....
Curated OER
Shaquille O'Neal Hand/Foot Span
Shaquille O'Neal has huge hands and feet, and learners will use those two measurements to practice collecting and extrapolating data using ratios. They record the measurement of foot and hand span of several of their classmates, then...
Curated OER
Data Collection and Presentation
Middle and high schoolers collect and analyze data from four different activities. The activities include information about classmates, tallying colors of cars in a parking lot, stem and leaf plots, and making a histogram from winning...
EngageNY
Estimating Probability Distributions Empirically 1
What if you don't have theoretical probabilities with which to create probability distributions? The 11th installment of a 21-part module has scholars collecting data through a survey. The results of the survey provide empirical data to...
Discovery Education
Fuss About Dust
Dust is everywhere around us; it's unavoidable. But what exactly is dust and are certain locations dustier than others? These are the questions young scholars try to answer in an interesting scientific investigation. Working...
Illustrative Mathematics
Favorite Ice Cream Flavor
What better way to engage children in a math lesson plan than by talking about ice cream? Using a pocket chart or piece of chart paper, the class works together creating a bar graph of the their favorite ice cream flavors. Learners then...
NOAA
How Do We Know?: Make Additional Weather Sensors; Set Up a Home Weather Station
Viewers learn about three different weather measurement tools in installment five of the 10-part Discover Your Changing World series. They build weather vanes to collect data on wind speed, barometers to determine air pressure, and rain...
Teach Engineering
Energy on a Roller Coaster
Roll with your class into the idea of conservation of energy. Pupils use a roller coaster track to collect data to reinforce the concept of conservation of energy and the influence of friction. Class members then create a graph from...
Statistics Education Web
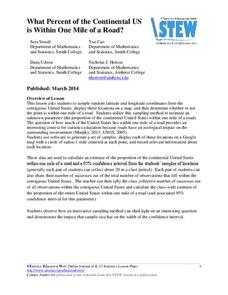
What Percent of the Continental US is Within One Mile of a Road?
There are places in the US where a road cannot be found for miles! The lesson asks learners to use random longitude and latitude coordinates within the US to collect data. They then determine the sample proportion and confidence interval...
Alabama Learning Exchange
Wheels All Around
Budding mathematicians explore the concept of skip counting. They practice skip counting as they use it to determine the number of wheels that come to school at 3 different times throughout the day. They also create a data graph to show...
Curated OER
Matchstick Math: Using Manipulatives to Model Linear, Quadratic, and Exponential Functions
Playing with matches (unlit, of course) becomes an engaging learning experience in this fun instructional unit. Teach pupils how to apply properties of exponential functions to solve problems. They differentiate between quadratic and...
Curated OER
A Planting We Will Go
Even the youngest kids can make scientific comparisons using collected data. They read The Tiny Seed, then discuss the essential nutrients and elements needed for a seed to grow into a blooming plant. They plant seeds and track their...
Curated OER
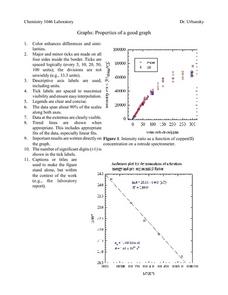
Properties of a Good Graph
In this chemistry worksheet, students examine the common characteristics of an acceptable graph that is meant to be used to display data.
Curated OER
Probability Lesson 3
Here are a few well-thought-out discussion questions intended to accompany a probability activity. Learners consider equal chance outcomes under given situations, they investigate those outcomes by tossing a coin 30 times. They analyze...
Curated OER
Mystery Jars
This is a twist on the old "guess how many jellybeans" game. Using estimation and math skills, learners participate in a fun "mystery jars" activity, trying to make educated guesses at how many objects are in two jars. The basic activity...
Curated OER
Stream Consciousness
Actual stream water is analyzed in this environmental science activity. Participants measure water temperature and pH, and then survey the macroinvertebrates living in their samples. The data worksheet, troubleshooting tips, and...
Curated OER
Create a Public Opinion Survey: The Middle East in the News
Though the discrete content here is a pair of New York Times articles about a 1998 military strike on Iraq and the coincident impeachment by the House of Representatives of then-President Clinton, this detailed plan for creating,...
Other popular searches
- Collecting and Recording Data
- Data Collection Techniques
- Math Lessons Data Collection
- Data Collection Activity
- Data Collection and Median
- Data Collection and Graphs
- Data Collection Projects
- Data Collection and Analysis
- Accurate Data Collection
- Data Collection Lesson Plans
- Experimental Data Collection
- Collection of Data


