Pingry School
Precipitation Reactions and General Solubility Rules
The more you know, the better your predictions! Using a hands-on lab experiment, collaborative groups collect information about ionic interactions. They record data describing the precipitate of reactions and use their information to...
Curated OER
Lesson: Culture & Change
Can a palace door be art? Can it facilitate an understanding of people and places? It certainly can! Using a palace facade as a lesson catalyst, kids will discuss geometric patterns, the kingdom of Swat, and geopolitical themes. They...
Purdue University
Getting the Dirt on Decomposition
Sometimes science requires getting a little dirty. A hands-on lesson explores the idea of decomposition by building a compost structure. Using red worms and dirt, individuals build and collect data on the rate of decomposition. The STEM...
Museum of Science
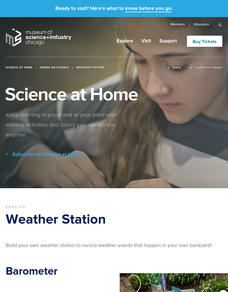
Weather Station
Find out what it is like outside before braving the elements. Teachers follow directions to build a barometer, rain gauge, and anemometer. Class members use the built weather instruments along with a thermometer to record weather...
Curated OER
Close Observation: Coins
Integrate math, science, and speaking/listening with a collaborative hands-on activity. Each group works with a single penny, examining it with the naked eye and recording observations. Repeat using magnifying glasses. Then repeat with a...
Pingry School
Solubility Product of an Ionic Compound
How do scientists determine when a solution is fully saturated? Scholars address the topic as they observe patterns of precipitation in various concentrations of ions. Using a well plate, pipette, and common chemicals, they collect data...
Curated OER
Collecting Data to Learn About the People Around You
Human graphs, anyone? Did you eat fruit today? What is your favorite costume? Have your K – 6 learners graph the responses. Early elementary grades may count and compare while upper grades compare responses of different groups or make...
Curated OER
Less and More Scavenger Hunt
Send your scholars on a measuring scavenger hunt with this interactive worksheet! They use a graphic organizer to record their findings as they search for items which are less than, more than, or just about one inch long. For each, they...
Curated OER
Oral History
Use oral history as a way to help learners develop communication skills. They interview a trusted adult about their life as a young person, challenges they overcame, and what they are proud of. Learners are then interviewed themselves in...
Curated OER
Ocean Exploration: How Doea you Data Grow? (Grades 7-8)
Learners explore fieldwork. In this seventh or eighth grade mathematics lesson, students watch a video on data collection in the field. Learners use fieldwork to gather data about their school environment. Students compile data in...
Curated OER
Chart This!
Students collect and analyze data. For this middle school mathematics lesson, students collect data on three to four traits or favorites. Students analyze their data and create a chart of graph for each trait or favorite they researched.
Curated OER
How do We Treat Our Environment?
Seventh graders explore the concept of collecting data. In this data collection instructional activity, 7th graders survey others about their environmental habits. Students graph their data.
Curated OER
Data Analysis
Twelfth graders collect and analyze data. In this secondary end-of-course mathematics instructional activity, 12th graders formulate a question they would like to answer and decide on an appropriate means of data collection. Students...
Curated OER
Let's Get Physical
Students collect data using the CBL. In this statistics lesson, students predict the type of graph that will be created based on the type of activity the person does. The graph represents heart rate depending the level of activity.
Curated OER
Critter Encounter Chart
Students record data found at an assigned web site. In this data collection lesson, students access an assigned web site in order to complete a data chart about animals they see. They travel to different sections of the web site to find...
Curated OER
Bird Feeding and Migration Observation
Students research bird migration and build a bird house. In this bird lesson plan, students research the birds in their area and where they migrate to. They also build their own bird house and record data on what kinds of birds come to...
Curated OER
Acid-Base Titration
Students determine the concentration of an unknown solution. This task assesses students' abilities to state hypothesis, develop procedures for investigation, plan for recording and organizing observations and data, collect data, create...
Curated OER
Do Not Open Until May 2000!
Students create a time capsule. In this time capsule lesson plan, students collect and record data about themselves to be stored in a time capsule that will be opened at the end of the year.
Curated OER
Surveys and Samples
In this surveys and samples instructional activity, students discover data collection techniques and write their own survey questions. Students use random sampling, convenience sampling, and systemic sampling and analyze their results.
Curated OER
Bouncing Ball Experiment
Students collect data for a bouncing ball and select one bounce to analyze. They explore the relationship between velocity, position and acceleration. They seek out connections between the graphs and the physical motion of the ball.
Curated OER
Race the Track! Jump the Gap
Students record data of using a track system with variables and how those variables affect a ball used in the track. In this track lesson plan, students design their own track in groups, test the ball's rates of speed, and record their...
Curated OER
Are There Too Many Elk?
Students use information about elk populations in Arizona to make recommendations about population management. In this ecology lesson, students discover the problems associated with having a heard of elk that is too large. After...
Curated OER
Using Diagrams in Problem Solutions
Students use tables, graphs and diagrams to collect data. In this problem solving with diagrams lesson plan, students construct their own tables and graphs containing information they gather from a drawing. They also make a Venn Diagram...
Curated OER
Collect and Organize Data: Reteach
In this data collection learning exercise, students learn the parts of a tally chart and how it organizes information. Students then use the second tally chart to help them answer the six questions.
Other popular searches
- Collecting and Recording Data
- Data Collection Techniques
- Math Lessons Data Collection
- Data Collection Activity
- Data Collection and Median
- Data Collection and Graphs
- Data Collection Projects
- Data Collection and Analysis
- Accurate Data Collection
- Data Collection Lesson Plans
- Experimental Data Collection
- Collection of Data


