Curated OER
Favorite Candy Bar Graph
Students decide on six different types of candy bars to include in a data collection activity. Working in small groups, they survey a target group in a set amount of time. They access a Internet based graphing tool to create a bar graph...
Curated OER
What's Your Favorite Season?
Students collect data on the favorite seasons. In this data collection and analysis instructional activity, students learn about displaying data on charts and graphs. They collect data about the favorite seasons of the children in their...
Curated OER
Canada Data Map
Students collect data and analyze it. In this algebra lesson, students collect data on the population characteristic in different regions. They use population, culture, settlement and others to help in their criteria.
Curated OER
Details, Details
Students explore statistics by participating in a personal details activity. In this data collection lesson, students identify the importance of personal information collection and how it can be used against them if collected illegally....
Curated OER
Skating Data
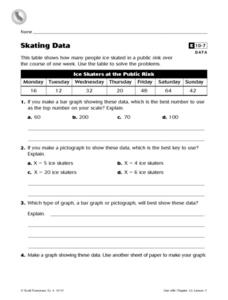
In this collecting data worksheet, 4th graders view a table on ice skaters at a public rink in order to answer 2 multiple choice questions, 1 short answer question and make a graph showing one piece of the data.
Curated OER
Do Caterpillars Eat More As They Get Bigger?
Learners observe caterpillar behavior and the amount of milkweed leaves the caterpillars eat each day. They collect data regarding the caterpillar's size and anything else they see. They look for patterns in caterpillar eating habits and...
Curated OER
Designing a Speedometer
In this algebra activity, students analyze the designs of a speedometer. They collect data on the distance and time as the speedometer works. They draw conclusion and make predictions from the collected data. There are 4 word problems.
Curated OER
Drip, Drip, Drip or The Case of the Leaky Faucet
Students explore the cost of wasted water. In this math lesson, students conduct an experiment in which they collect data on how much water is lost when a faucet leaks. Students figure the cost of the water that was wasted.
Curated OER
Documenting Science Through an Active Inquiry Process
Students follow procedures regarding scientific data collection. In this scientific inquiry lesson plan, students investigate inquiry questions through research and data collection. Students use technology tools to create products that...
Curated OER
Data-gathering Activities Relating to Trees in Their Environment
Students gather data relating to trees in their environment. In this biology lesson plan, students determine heights of trees and their ages. A canopy map will indicate optimal growing areas for the tree.
Curated OER
Cloud Types
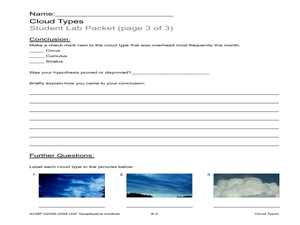
Students examine cloud types. In this cloud lesson, students identify cloud types, observe clouds and collect data, and analyze data to identify the most common cloud they observe overhead during the course of a month.
Curated OER
Maglev Train
In this statistics learning exercise, students collect data on train time using speed and time. They differentiate between the upper and lower bound of their data. There are 7 questions on 2 pages.
Curated OER
Entrance Ticket
Learners collect data on different events and word problems. In this algebra lesson, students use a table to organize their data. They graph their coordinate pairs on a coordinate plane and make predictions.
Curated OER
Family TV
In this family TV worksheet, students study, examine and make predictions about several television shows, collect data and then chart their data collected.
Curated OER
Data Collection Review Sheet
In this data collection worksheet, students determine the number of significant figures in the given values, describe the difference between accuracy and precision, and calculate density and mass. This worksheet has 1 short answer...
Curated OER
Bean Growth Project Graph Worksheet
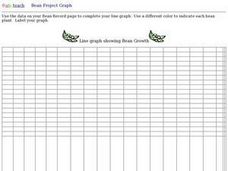
In this bean growth project graphing learning exercise, student collect data and create a line graph. They use a different color for each line that shows the growth of each bean plant.
Curated OER
Favorite Sports Graph
In this data collection and graph learning exercise, students ask each classmate which sport is their favorite based on the ones shown at the bottom of the graph. They color a square for each response, and tell the most and least popular...
Curated OER
Mini Games
Students play a series of mini games in order to learn basic concepts in science and math. In this data collection lesson, students weigh rice, count time, participate in a marble grab, look at big feet, participate in a sponge squeeze,...
Curated OER
Dental Arithmetic: Sugar Clocks
Students analyze data about their teeth. In this data collection lesson, students determine how often their teeth should be brushed during the day. Students also estimate the amounts of sugar in 17 foods.
Curated OER
Months of the Year
Students practice interviewing. In this months of the year lesson, students interview at least five adults working in their school to gather data on when their birthdays occur. Students create a master calendar for the school.
Curated OER
Tally the Objects in the Picture
In this tally the objects in the picture worksheet, 1st graders count the objects in each picture and place a tally mark in the chart as a means of collecting data.
Curated OER
Graphing Conversation Hearts
Students collect data and create a graph. In this mathematics lesson, students separate paper hearts by color and create a graph showing the number of hearts of each color present. Students receive a handful of candy hearts that they use...
Curated OER
First Grade Shoe Sizes
Third graders collect shoe size data from classmates in their room and another third grade. They predict what the most common shoe size will be. They place the data in an spreadsheet on the computer. They design a graph using the...
Other popular searches
- Collecting and Recording Data
- Data Collection Techniques
- Math Lessons Data Collection
- Data Collection Activity
- Data Collection and Median
- Data Collection and Graphs
- Data Collection Projects
- Data Collection and Analysis
- Accurate Data Collection
- Data Collection Lesson Plans
- Experimental Data Collection
- Collection of Data


