Kenan Fellows
Using Water Chemistry as an Indicator of Stream Health
Will this water source support life? Small groups test the chemistry of the water drawn from two different sources. They then compare the collected data to acceptable levels to draw conclusions about the health of the source. The...
EduGAINs
Chemical Properties Investigation
This instructional activity demonstrates differentiated instruction at its best. Over the course of 2-3 class periods, young chemists have the opportunity to gain a thorough understanding of metals and their chemical properties from a...
Balanced Assessment
Solar Elements
Let your brilliance shine like the sun. Future mathematicians and scientists consider given data on the abundance of different elements in the sun. The assessment task requires consideration of how these different abundances relate to...
Statistics Education Web
Consuming Cola
Caffeine affects your heart rate — or does it? Learners study experimental design while conducting their own experiment. They collect heart rate data after drinking a caffeinated beverage, create a box plot, and draw conclusions....
Kenan Fellows
Effects of a Golf Course on Stream Health
Is the golf course causing issues in the stream? Find out with a resource that has groups perform chemical water tests to analyze the effects of a golf course on a stream. Pupils collect water above and below the course and analyze the...
Kenan Fellows
Determining the Effects of a Golf Course on Stream Health
Do golf courses affect the water organisms in nearby streams and ponds? Small groups collect samples of water upstream and downstream from a golf course and analyze the macroinvertebrates found and the stream index values of...
PHET
Mapping the Field of Multiple Dipole Magnets
So you built a magnetometer, now what? High school scientists use their magnetometer made in a previous lesson to map the union of magnetic fields of dipole magnets. They experiment with different alignments and draw conclusions about...
Balanced Assessment
Stock Market
Analyze trends in the stock market using histograms. Future economists use data presented in a histogram to find periods of greatest increase and decrease. They also draw conclusions about days that would be best to invest.
University of Colorado
The Moons of Jupiter
Can you name the three planets with rings in our solar system? Everyone knows Saturn, many know Uranus, but most people are surprised to learn that Jupiter also has a ring. The third in a series of six teaches pupils what is around...
Chicago Botanic Garden
Climate Change Around the World
Look at climate change around the world using graphical representations and a hands-on learning simulation specified to particular cities around the world. Using an interactive website, young scientists follow the provided...
Chymist
Landfills and Recycling
Examine the nature of landfills through experimentation. Scholars build miniature landfills and monitor changes over a six-week period. Observations allow individuals to draw conclusions about the different types of trash and their...
K5 Learning
The Fox and the Little Red Hen
Read about the fox family that decides to cook a hen for dinner. After reading, individuals answer questions about the elements of plot in the story. They require drawing conclusions, making predictions, and describing specific...
CK-12 Foundation
Stow Lake
Does the depth of a pond matter to the waves created when rain is falling? Many people assume the answer is no, but interestingly, it does matter. Pupils explore this concept and other variables related to wave behavior through a...
University of Minnesota
C. elegans and Alcohol
Investigate experimental design through a hands-on exploration. A creative lesson allows learners to design an experiment to monitor the effects of alcohol on the C. elegans worm. After conducting the experiment, individuals analyze...
Florida International University
Pipeline to the Coral Reefs
Discover firsthand the effects of internal waves on coral reefs. Through a series of experiments, learners simulate internal waves and upwelling events as they make observations on the movement of water and other debris. They then...
Concord Consortium
Pressure Equilibrium
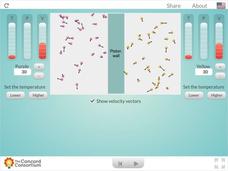
All together now! Physical science pupils observe the effects of temperature and amount of substance on pressure and volume of a gas. The interactive resource guides learners through the Combined Gas Law, where they observe changing...
Beyond Benign
Exothermic and Endothermic Reactions
How can you tell the difference between endothermic and exothermic reactions? Chemistry scholars perform and observe two chemical reactions, measure the temperature throughout, then draw conclusions about changes in energy from their...
Beyond Benign
Water Waste
Explore the process of wastewater treatment. Scholars analyze different samples of water before drawing conclusions about the types of chemicals in the water that leaves our homes.
Nuffield Foundation
Effect of Size on Uptake by Diffusion
Cell size is limited by the surface area to volume ratio, but why is this true? Scholars measure the surface area and volume of cubes before placing them into liquid. After a set amount of time, they measure the uptake by diffusion for...
Kenan Fellows
Saving Those Who Save Us: Exploring the Use of Sensors with Data Visualization
Sensor technology is amazingly accurate and useful. Combining the sensor technology and mathematical knowledge, scholars design experiments to answer a question they have developed. Questions may focus on light sensing, temperature...
Central Bucks School District
Making Generalizations
Being able to recognize patterns, craft generalizations, and draw conclusions based on information in a text passage are essential critical thinking skills. Encourage learners to hone these skills with a worksheet that asks them to read...
Concord Consortium
Gestation and Longevity
Is the gestation length of an animal a predictor of the average life expectancy of that animal? Learners analyze similar data for more than 50 different animals. They choose a data display and draw conclusions from their graphs.
Concord Consortium
Circumscribed Polygon
Trigonometry teachers often go off on a tangent, and here's a worksheet that proves it! First, young mathematicians use a formula with tangent to prove a formula correct for area. Then, they draw conclusions about the area of a circle...
Council for Economic Education
Inflation Data: Is the Economy Healthy?
What stories do current trends tell about society, fashion, and the future? Scholars investigate the concept of inflation and its impact on the future of the American economy. They compile current economic data to determine the level of...
Other popular searches
- Drawing Conclusions Reading
- Data. Drawing Conclusions
- Drawing Conclusions Lessons
- Drawing Conclusions in Reading
- Data Drawing Conclusions
- Reading "Drawing Conclusions
- Drawing Conclusions Worksheets
- Drawing Conclusions Science
- Drawing Conclusions From Text
- Drawing Conclusions Activities
- Drawing Conclusions From Data


