Alabama Learning Exchange
Bloodstain Pattern Doesn't Lie......
An interesting instructional activity on hypothesizing about the diameter of a drop of blood that is splattered. To test their theories, learners work in groups to make blood droplets splatter from different heights. They use graphed...
Curated OER
Volume, Mass, and Weight
Study the difference between mass and weight. Your math group will compare the weight of an item to the amount of space that it uses. They'll then use conversion factors to find the difference between kilograms and pounds. Essential...
Columbus City Schools
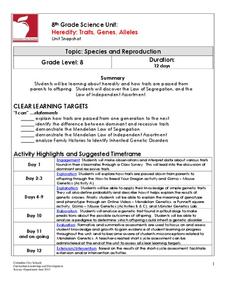
Heredity: Traits, Genes, Alleles
If you knew people would pay extra for a bald dragon, could you pick which parents you should breed in order to get the highest number? The unit examines heredity and genetics through breeding dragons, mice, dogs, and tries to figure...
Curated OER
Matchstick Math: Using Manipulatives to Model Linear, Quadratic, and Exponential Functions
Playing with matches (unlit, of course) becomes an engaging learning experience in this fun instructional unit. Teach pupils how to apply properties of exponential functions to solve problems. They differentiate between quadratic and...
Curated OER
Reading Comprehension 6: Level 12
Although designed as an assessment, consider using this resource as the basis for a lesson on reading comprehension strategies or as a practice exercise. The five multiple choice questions, based on a short passage about stock market...
Curated OER
M&M Science and Math
A series of math and science activities feature M&M's® as manipulatives to help kids work through equations. The resource includes exercises on finding averages, percent of compositions, moles in chemical reactions, genotypes and...
University of Colorado
Punnett Squares with Piebald Deer
Explore the science behind Earth's amazing diversity of life with this lesson plan on genetics. Looking at specific traits in piebald deer, carnations, and roan cattle, young scientists use Punnett squares to determine the possible...
It's About Time
The Doppler Effect
In 1842, Christian Doppler proposed a theory relating the change of wavelengths based on motion. Young scholars observe the Doppler Effect on a small scale in a ball, on a larger scale from a car, and on the largest scale studying the...
University of Colorado
The Moons of Jupiter
Middle schoolers analyze given data on density and diameter of objects in space by graphing the data and then discussing their findings. This ninth installment of a 22-part series emphasizes the Galilean moons as compared to other objects.
University of North Carolina
Modals
If you could have any job in the world, what would it be? Modal verbs such as could and would express possibility, as the installment of a compilation of informational handouts describes. A series of tables help explain the strength,...
Pearson
Will for the Future; Future Time Markers
What will happen in the future? No one knows, but everyone can guess with the future tense! Young grammarians practice future time markers with a helpful presentation that focuses on air travel to space.
University of Colorado
The Moons of Jupiter
Can you name the three planets with rings in our solar system? Everyone knows Saturn, many know Uranus, but most people are surprised to learn that Jupiter also has a ring. The third in a series of six teaches pupils what is around...
Curated OER
Raisin the Statistical Roof
Use a box of raisins to help introduce the concept of data analysis. Learners collect, analyze and display their data using a variety of methods. The included worksheet takes them through a step-by-step analysis process and graphing.
Curated OER
Finding Equations
Students make equations from everyday data. They create a graph from the equations. Students predict and analyze the results. Students complete the second scenario on their own and turn in their handout.
Shodor Education Foundation
Graphing and the Coordinate Plane
Ready to introduce your class to the coordinate plane? This website includes a detailed lesson plan that includes two interactive games to help learners practice graphing ordered pairs. The scripted discussion is a little cheesy and a...
Curated OER
Play It
There are a number of activities here that look at representing data in different ways. One activity, has young data analysts conduct a class survey regarding a new radio station, summarize a data set, and use central tendencies to...
Curated OER
Where Does Your Garbage Go?
The objective of this activity is to teach pupils about the importance of recycling. Initially, students have a chance to think about their impact on our planet by following the path that garbage takes. Pupils then learn about how...
Curated OER
Political Polls
Students explore politcical polling by conducting a poll of student body elections. They prepare a survey, distribute forms, and tabulate data.
Curated OER
Seasons and Cloud Cover, Are They Related?
Students use NASA satellite data to see cloud cover over Africa. In this seasons lesson students access data and import it into Excel.
Curated OER
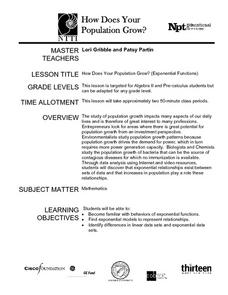
How Does Your Population Grown?
Do you know how the population has grown of your community? Can you predict the population over the next half century? Can we find an algebraic model that matches our data? These along with many more questions can be researched by...
Curated OER
How Alike Are We?
Fourth graders find the range, mode, median, and mean for each of the data sets (height and shoe size). They discuss which measure of central tendency for each data set best represents the class and why. Students graph the shoe size and...
Virginia Department of Education
Numbers in a Name
What's in a name? Pupils create a data set from the number of letters in the names of classmates. Each group then takes the data and creates a visual representation, such as a histogram, circle graph, stem-and-leaf plot, etc.
Curated OER
Shaping Up!
Kindergartners are introduced to basic shapes. Learners spend 45 minutes a day in geometry centers carrying out the activities outlined in this ambitious plan. There are games, hands-on activities, interactive websites, art projects,...
Curated OER
Mean Absolute Deviation in Dot Plots
The lesson focuses on the ideas of dot plot representations and the mean absolute deviation of data sets.


