Curated OER
Graphing and the Coordinate Plane
Students gain practice reading coordinates and plotting points by participating in the Coordinates! Game. They demonstrate and test their skills with graph paper and the Maze Game.
Curated OER
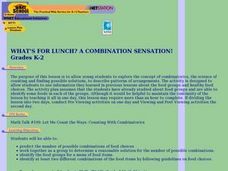
What's For Lunch? A Combination Sensation!
Students combine different foods to make possible lunches and determine the specific combinations of lunches that can be made from a finite set of foods.
Curated OER
Hush! A Thai Lullaby
Students listen as the teacher reads a story from their textbooks about a tradition in Thailand. They locate Thailand on a map and discuss that it is a tropical country. They discuss various cultural aspects included in the story and...
Curated OER
Scale Me Down
Students create scale drawings, and ultimately scale models, of real-world objects in this Math lesson about ratios, proportion, scaling factors, and cross products. The lesson includes ideas for cross-curricular extensions and is...
Curated OER
Reduce, Reuse, Recycle
Fourth graders discover the differences between: reduce, reuse, and recycle by performing hands on examinations. They list what would happen to the soil if we allowed the earth to wash away and briefly discuss the meaning of erosion.
Curated OER
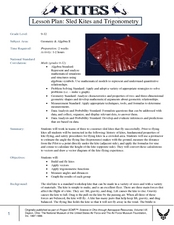
Sled Kites and Trigonometry
Students study the history of kites and their fundamental properties. In this kites instructional activity students divide into teams and build and fly kites.
Curated OER
Lesson 56
Sixth graders practice Least Common Multiple in fractions. In this fraction lesson, 6th graders look at two different fractions and find a common denominator. They sing a song to memorize mean, median, and mode.
Curated OER
Pattern
Students describe examples of the relationship between structure and function in living systems, particularly with regard to specialized tissues and organs. They describe examples of biological diversity and adaptation of organisms with...
Curated OER
Geological Forces and Topography
Students discuss and research the Earth's geological processes. In this geology lesson plan, students study maps of Utah and the United States to learn about geological features. Students then complete the research cards for each area of...
Curated OER
RISKY BUSINESS--OR NOT!
Students learn about the importance and risk that stocks carry within a business. In this financial management lesson, students use role play and case scenario situations to decide what stocks are best for given companies. Based on the...
Curated OER
School-Wide Recycling
Students investigate recycling. In this environmental lesson, students design a recycling program for their school. Students collect data about how much recyclable materials they use in one week. Students also survey classmates about how...
Curated OER
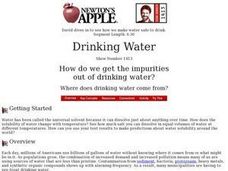
Still Waters
Students construct a still to turn seawater into drinking water. They estimate the cost of distilling it. They investigate ways to make the conversion more efficient. They track the source of their home drinking water and make a map of...
Curated OER
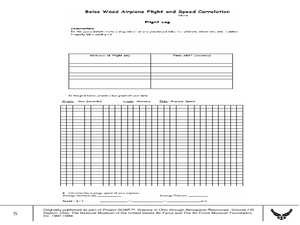
Balsa Wood Airplane Flight and Speed Correlation
Ninth graders calculate the average speed of their balsa wood airplane. For this physics lesson, 9th graders build their own airplane and make necessary modifications to to make it fly straight. They interpret distance and time graph...
Curated OER
Concrete Canoes
Students explore and analyze the relationship of buoyancy and displacement needed to make an object float. They examine various boat designs, then design and build clay and aluminum boats that hold a cargo of marbles.
Curated OER
Box Plots on the TI-83 Calculator
Eighth graders research box plots on the Internet. They gather real life statistics and analyze the collected statistics by making multiple box plots on the TI-83 calculator.
Curated OER
Super Spreadsheets
Learners develop a spreadsheet containing statistical data. They describe and interpret the data to make conclusions. They review the differences between an unorganized spreadsheet verses an organized one.
Curated OER
Getting A Grip On Graphs
Fourth graders investigate the concept of graphing and comparing different types of data using pictographs, line graphs, scatter plots, etc... They gather data and make interpretations while examining the medium of how it is displayed.
Curated OER
What You See Is Not Always What You Get!
Students estimate and calculate the distance of a shape. In this algebra instructional activity, students differentiate between a horizontal distance and it's reflected image. They measure the reflection and the point starting at the eye...
Curated OER
What's The Point?
Students solve word problems using the correct math symbols. In this algebra lesson, students use the TI calculator to graph their equation and analyze it. They find the line of regression and use to draw conclusion.
Curated OER
I See Shapes
Students explore shapes through literature. In this language arts lesson, students read stories about shapes and discuss the shapes they see in the stories. Students find shapes around the room.
Curated OER
Getting A Grip On Graphs
Fourth graders gather variety of data and create a graphs to display the data.
Curated OER
Health Education: Germs
Second graders examine germs. In this personal health lesson plan, 2nd graders summarize the methods for preventing the spread of germs through food, water, air, and touch.
Curated OER
What's Your Favorite? Survey And Graphing Project
Sixth graders create and edit spreadsheet documents using all data types, formulas and functions, and chart information. They collect and organize data that be portrayed in a graph that they create using EXCEL.
Curated OER
The Conscription Crises
Students explore roles played by Canada's prime ministers The Right Honorable Sir Wilfrid Laurier and The Right Honorable iam Lyon Mackenzie King with regards to the conscription crises of World War I and World War II.


