EngageNY
Using Sample Data to Compare the Means of Two or More Populations II
The 23rd segment in a series of 25 presents random samples from two populations to determine whether there is a difference. Groups determine whether they believe there is a difference between the two populations and later use an...
UAF Geophysical Institute
Carbon Footprint
Your young environmentalists can calculate their carbon footprint and discuss ways to reduce it with a worksheet about climate change. After reading a handout about what impact one's carbon footprint can have on the environment, kids...
UAF Geophysical Institute
System Interactions: The Lorax and the Truffula Tree
If the Lorax were to write a letter, what would he write? Introduce your class to systems and feedback loops through the whimsical stylings of Dr. Seuss. Learners take on the Lorax's point of view to write a letter, among other activities.
Curated OER
Space Food
What do astronauts eat in outer space? Kids can read an informational passage to learn about space food. The passage includes prompts that have learners identify the main idea and key details, then write a paragraph summarizing the text....
Curated OER
Today’s Telephone
Does your class know the history behind today's telephone? They will after reading a very interesting one-page informational passage. They'll learn all about the way phones have progressed to the amazing devices they've become as they...
DePaul University
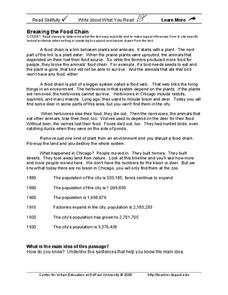
Breaking the Food Chain
Throughout history, the growth of big cities has resulted in the destruction of ecosystems. In the case of Chicago, IL, a grassland that was once home to bison, deer, wolves, and foxes quickly became a booming city of over three million...
Curated OER
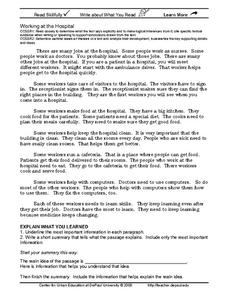
Working at the Hospital
Having this reading passage handy to assess your learners' ability to process written text, practice summary with your class, and improve reading comprehension. This passage is about the people who work at the hospital. Learners read...
Memorial Art Gallery
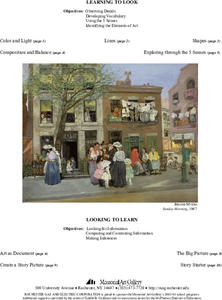
Learning to Look, Looking to Learn - Sunday Morning
Jerome Myers' depiction of the urban landscape in "Sunday Morning" is the focus of a series of activities that asks viewers to examine how an artist uses the elements of a painting to tell a story. The resource packet includes an...
Noyce Foundation
Ducklings
The class gets their mean and median all in a row with an assessment task that uses a population of ducklings to work with data displays and measures of central tendency. Pupils create a frequency chart and calculate the mean and median....
Virginia Department of Education
Graphs
Examine different types of graphs as a means for analyzing data. Math scholars identify the type of graph from a series of data displays and then develop questions to match each one. Then, given a scatter plot of height versus age...
Achieve
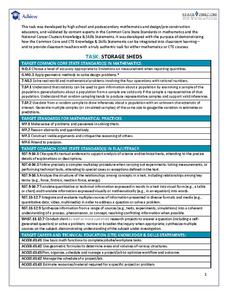
Task: Storage Sheds
Bridge the gap between mathematics and Career Technical Education. Pupils research the cost associated with building storage sheds and analyze possible profit. They build scale models and determine if building and selling the sheds is a...
EngageNY
Using Sample Data to Compare the Means of Two or More Populations
Determine whether there is a difference between two grades. Teams generate random samples of two grade levels of individuals. Groups use the mean absolute deviation to determine whether there is a meaningful difference between the...
Curated OER
Schedules & Technology
Learn more about technology through matching, dictation, and word identification. English learners will participate in a variety of activities as they learn more about technology.
Google
Surveys and Estimating Large Quantities
Looking for an estimation activity a bit more involved than the typical "guess the number of jellybeans in the jar" game? Here, learners use a picture to estimate the number of people at a large event, look for potential problems with...
It's About Time
Where are the Volcanoes?
Middle school geologists map the volcanoes closest to themselves, learn about map distortion, and infer possible future volcano locations. A focus on latitude, longitude, and volcanoes beneath the ocean helps connect the lesson.
Statistics Education Web
Text Messaging is Time Consuming! What Gives?
The more you text, the less you study. Have classes test this hypothesis or another question related to text messages. Using real data, learners use technology to create a scatter plot and calculate a regression line. They create a dot...
Statistics Education Web
You Will Soon Analyze Categorical Data (Classifying Fortune Cookie Fortunes)
Would you rely on a fortune cookie for advice? The instructional activity first requires future statisticians to categorize 100 fortune cookie fortunes into four types: prophecy, advice, wisdom, and misc. The instructional activity goes...
Statistics Education Web
Consuming Cola
Caffeine affects your heart rate — or does it? Learners study experimental design while conducting their own experiment. They collect heart rate data after drinking a caffeinated beverage, create a box plot, and draw conclusions....
Curated OER
Literature-based Skill Building: Holes by Louis Sachar Chapter 14
In this literature response instructional activity, learners answer 20 short essay questions about Chapter 14 of the book called Holes by Louis Sachar.
Curated OER
Shizuko’s Daughter: Selective Reading Guide
Examine the text of Kyoko Mori's Shizuko's Daughter with a reading guide. With questions that prompt kids to refer to the reading as well as to their own experiences and opinions, the guide is an effective way to keep them engaged...
Curated OER
Desert Adaptations
In this desert adaptations worksheet, students are given a water filled sponge which represents an animal. Students observe their "animal" for a 24 hour period and conserve the water in the sponge as best they can. They measure and...
Curated OER
Doing a Lab Write Up
In this science worksheet, students examine the topic in order to solidify knowledge covered in the curriculum using puzzles and creative games.
Curated OER
How HIV Infects Cells
In this how HIV infects cells worksheet, students read the given information about how HIV infects cells. Students explain the role of various structures in HIV infection. Students design a drug that might slow the rate of cellular...
Curated OER
Clues to Copying the Code
In this DNA worksheet, students access a website to determine the information that was used to understand DNA replication. Students compare the difference between observations and opinions. This worksheet has 7 short answer questions and...


