Curated OER
Probability
Ninth graders engage in a lesson that is about the concept of probability using the context of recording data and predicting outcomes. They collect marbles while recording data and graphing it. The graph is analyzed and ideas are...
College Board
2010 AP® Statistics Free-Response Questions Form B
Form a good familiarity with the AP® test using Form B of the 2010 AP® Statistics free-response questions. Pupils use a test from a previous administration to prepare for their exams. A set of six questions assesses box plots,...
Curated OER
M&Ms Count and Crunch
Middle schoolers practice skills involving statistics and probability by making predictions on number of each color candy in one pound bag of M&Ms. They record both guesses and actual quantities, calculate percentages, and create bar...
Curated OER
Statistics and Probablility
Statistics and Probability are all about collecting, organizing, and interpreting data. Young learners use previously collected data and construct a picture graph of the data on poster board. This stellar lesson should lead to...
Yummy Math
Starbucks Drinks
The casual language and popular topic will make this assignment all the more engaging for your middle school math class. They use Starbucks beverage sales and nutrition values to practice ratios, proportions, statistics, and...
College Board
2011 AP® Statistics Free-Response Questions Form B
Is the sequel better than the original? The 2011 AP® Statistics free-response questions, Form B, is available for instructors to reference. Among the topics covered in the exam are histograms, distributions, studies and experiments,...
Math Worksheets 4 Kids
Probability Worksheet
Your learners probably will enjoy practicing a variety of concepts as they work through these eight probability worksheets. The first few worksheets emphasize basic probability using cards, the months in a year, and the number of...
Curated OER
Probability
In this statistics and probability worksheet, high schoolers determine the probability of a series of dependent and independent events occurring. The one page worksheet contains a combination of ten multiple choice and free response...
Curated OER
Probability
In this statistics and probability worksheet, students determine the probability of a series of events occurring. The one page worksheet contains a combination of seven multiple choice and free response questions. Answers are included.
Curated OER
Evaluating Simple Probabilities
For this Statistics and Probability worksheet, students solve problems involving simple probability. The one page worksheet contains five multiple choice questions. Answers are provided.
Curated OER
The Counting Principle, Sample Spaces, and Probability
In this statistics and probability worksheet, students solve problems in which they use the counting principle and/or tree diagrams to determine the number of outcomes of an event or the probability of event occurring. The three page...
Curated OER
Conditional Probability and Probability of Simultaneous Events
Students explore the concept of conditional probability and probability of simultaneous events. In this conditional probability and probability of simultaneous events lesson plan, students roll dice or use and applet to roll dice to...
Curated OER
Leveled Problem Solving: Experimental Probability
For this using probability to solve word problems worksheet, students use statistics, averages, and even numbers, to problem solve. Students solve six problems.
Curated OER
Probability- Two Events
For this statistics worksheet, students examine different events after translating the word problems into equations and choose which event is most likely to occur. There are 14 questions with an answer key.
Curated OER
Permutations, Combinations, and Probability
In this probability-worksheet, 11th graders calculate the permutation, combination and probability of an event occurring. There are 5 questions with an answer key.
Curated OER
Probability of One Event
In these finding the probability worksheets, students use a dart board, playing cards, and a board game to problem solve. Students solve 17 problems.
Curated OER
Finding Probability
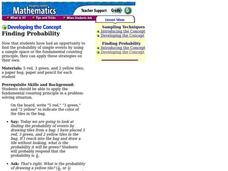
Students demonstrate how to find the probability of events. In this probability lesson, students use colored tiles in a paper bag and randomly select one at a time to record the probability.
College Board
Engaging the Intuition in Statistics to Motivate
Motivation is key to learning. The author points out that it is important to engage intuition for aspects of statistics that pupils find counter-intuitive. Three strategies—using multiple representations, using intuitive analogies, and...
Curated OER
Statistics and Shopping
Explore how statistics are used in everyday life. Your soon-to-be savvy consumers use the Internet to find consumer-related statistical information and learn to make wise consumer decisions. Includes links to a practice sheet about data...
Curated OER
Statistics with M&Ms
Seventh graders explore estimation, measurement, and probability. Students conduct surveys and create charts & graphs. They study the history of chocolate. Students design their own magazine advertisement or create a script for a...
Curated OER
Binomial Probability Distribution Section 5.4
In this Binomial Probability Distribution, young scholars use the binomial probability formula to determine the success of a given probability. Using the given parameters, students write a probability equation and solve the problem. They...
Curated OER
Countdown Challenge: Probability and You
In this probability worksheet, students explain how probability is a part of everyday life by discussing six different scenarios. Afterwards, they draw a picture of probability in their life. This one-page worksheet contains a total of...
Curated OER
Probability
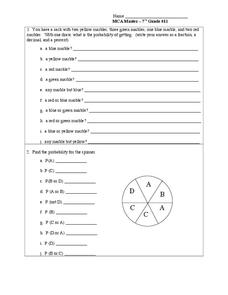
Seventh graders solve and complete 2 different problems that include a number of other possibilities. First, they draw a marble as stated for each out of a sack of marbles and determine the probability of getting that particular marble....
Curated OER
Fire!, Probability, and Chaos
Upper elementary and middle schoolers work with the concept of probability. They are introduced to the concept of chaos. Learners graph and analyze using a line plot, work with mean, and are introduced to the concept of variance.


