Curated OER
Standard Form Equation of Ellipse
In this equation of an ellipse worksheet, students find the missing numbers in 8 equations when given the drawing of the ellipse. Students graph 9 ellipses on a coordinate grid when given the equation. In the final activity, students...
Curated OER
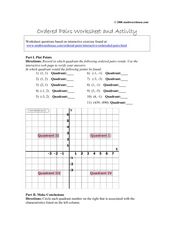
Ordered Pairs Activity
In this geometry worksheet, 10th graders match ordered pairs to the correct quadrant on a coordinate plane. They tell in which quadrants x and y values will be positive or negative. There are 19 questions.
Curated OER
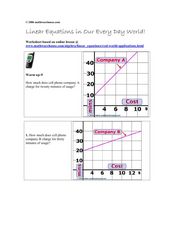
Linear Equations in Our Every Day World!
In this linear equations instructional activity, students read and interpret graphed linear equations. They read a story problem, write a linear equation, and plot the points on a coordinate plane. This five-page...
Curated OER
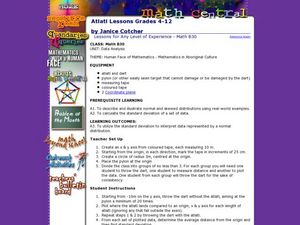
Human Face of Mathematics - Mathematics in Aboriginal Culture
Students collect statistical data. In groups, students play a dart game and then determine the distance between darts. They collect the data and plot the information on a coordinate plane. They identify the mean and the...
Curated OER
TI-Nspire Activity: What Does Your Representation Tell You?
By learning to select the best representation for three meal plans, students compare three meal plans to determine the best choice. Data for the meal plans is sorted on a table, as an algebraic equation, and graphed on a coordinate grid....
Curated OER
Area of Geometric Shapes
In this geometry activity, students solve for the area of polygons. They are given shaded shapes on a coordinate plane and asked to calculate the area. There are 2 questions with an answer key.
Curated OER
Graphs with Algebra and Geometry
In this math worksheet, students analyze graphs, the coordinate plane and angles. They identify polygons based on their number of sides and interior angles. There are 4 questions with an answer key.
Curated OER
Mine Shaft Grade 8 Slope
Eighth graders investigate slopes using real life scenario. In this algebra lesson, 8th graders model and interpret real life data. They plot their data in a coordinate plane and discuss the results with the class.
Curated OER
Graph Linear Inequalities
In this algebra worksheet, students solve linear inequalities and graph their results on a coordinate plane. They shade the correct side of the line. There are 8 questions with an answer key.
Curated OER
Properties of Exponential Functions
For this algebra worksheet, students graph exponential equations and use the formula to translate the graph on a coordinate plane. There are 3 word problems.
Curated OER
Graphing Absolute Value Equations
In this algebra learning exercise, students graph absolute value equations and use translations to move the graph around on a coordinate plane. There are 4 questions with an answer key.
Curated OER
Scatterplots
Students evaluate equations and identify graphs. In this statistics lesson, students identify plotted points on a coordinate plane as having a positive, negative or no correlation. They complete basic surveys, plot their results and...
Curated OER
More graphing situations by making a table
Students make a table and graph plotting points. In this algebra lesson plan, students graph linear equations on a coordinate plane. They calculate the rate of change and analyze the graph for extrapolation.
Curated OER
More Graphing Situations by Making a Table
Young scholars calculate rate of change and graph linear functions. In this algebra lesson students write linear functions, make a table of points and graph their data on a coordinate plane. They calculate the rate of change of a graph.
Curated OER
Algebra 1, Unit 7, Lesson 8: Practice Finding the Equation of a Line
Young scholars solve systems of linear equations by graphing. The introduction of the instructional activity asks students to work in pairs or small groups to graph a line when given two points. Young scholars graph 14 equations on the...
Curated OER
Data Collection and Graphing
Students collect data and graph it on a coordinate plane and analyze it. For this statistics lesson, students display their data collection using a graph. They determine which central tendency will work best.
Curated OER
Data and Scientific Graphs
Students conduct experiments and graph their data. In this statistics lesson plan, students collect data and graph it on a coordinate plane. They analyze the data looking for patterns and they discuss their findings with the class.
Texas Instruments
Mean Value Theorem
Students calculate the slopes of secant lines. In this calculus lesson, students graph tangent and secant lines using the coordinate plane. They use the Ti calculator to graph and observe the lines.
Curated OER
Points on a Line
How do you find slope? You use points on a line of course. slope. Teach your class how to calculate and differentiate between horizontal and vertical lines. They are sure to be pros at graphing lines on a coordinate plane by the end of...
Curated OER
Zeros of a Quadratic Function
Factor quadratic equations by teaching your learners how to identify the zeros of the quadratic function. They use the TI to see where the graph will intercept the coordinate plane.
Curated OER
Polynomial Rollercoaster
Learners relate polynomials to a rollercoaster track as they translate a graph around on a coordinate plane. They differentiate between different forms of algebraic expressions.
Curated OER
Millennium Bridge
Students read and plot coordinates in all four quadrants and state where a shape will be after translation. They explore the concept of translation using a a four quadrant grid of the of River Tyne running through all 4 quads. In...
Curated OER
Latitude
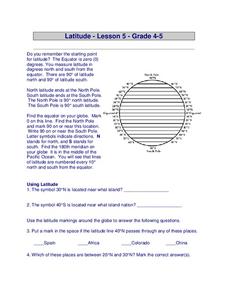
For this latitude worksheet, students answer questions about latitude that include absolute locations of countries and coordinates. Students complete 12 questions.
Curated OER
Straight Line Graphs
Students discover certain equations produce straight lines. In this graphing lesson, students draw axis and problem solve to find coordinates to graph.


