Curated OER
The Noughties
In this World History worksheet, 9th graders read an article and answer nine comprehension questions. Students write definitions to vocabulary words.
Curated OER
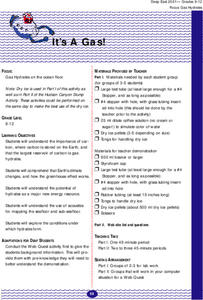
It's a Gas!
High schoolers explore the conditions under which hydrates form. They use the Internet to access information and conduct experiments to examine how the greenhouse effect works.
Curated OER
Early Arkansas Geography
Seventh graders locate and describe historical Arkansas while using a historical map.
Curated OER
Barometer Investigation
Students construct a barometer to use in an experiment that they design to measure the air pressure on a daily basis. These observations of air pressure allow students to determine how weather is affected when a storm is approaching and...
Curated OER
The Four Seasons
Students examine four paintings by Robert Harris and identify the season portrayed. Using the characteristics for each season, they write a poem and create a drawing of their own. In groups, they describe the different types of...
Curated OER
ANIMALS OF ANTARCTICA
Students are introduced to the animals of Antarctica and how they adapt to their environment and the changes of the seasons after being read the story,"Counting Penguins" . They pick an animal and predict how he/she thinks this animal...
Curated OER
Mass Balance Model
Students explore the concept of mass balance, flow rates, and equilibrium using a simple water bucket model. In this JAVA based online interactive modeling activity, they vary flow rate into the bucket, initial water level in the bucket,...
Curated OER
The Modern Atmospheric CO2 Record
Students compare carbon dioxide (CO2) data from the Mauna Loa Observatory , Barrow (Alaska) , and the South Pole over the past 40 years to help them better understand what controls atmospheric (CO2).
Curated OER
Group Research Project on Frog Habitats
Students identify and research a frog habitat in small groups and compile a report to present to the class on the physical characteristics of their frog's environment. Students create a map illustrating areas in the world where their...
Curated OER
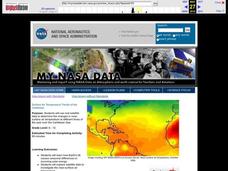
Surface Air Temperature Trends of the Caribbean
Students investigate the seasonal changes to sea surface and near-surface air temperatures near the equator. They use actual satellite data to track and graph the differences in air and sea temperatures during different seasons in the...
Curated OER
Great Blobs of Jelly!
High schoolers explain how zoo-plankton have an impact on the global process. In this ocean zoo-plankton lesson students calculate carbon flux and plankton densities.
Curated OER
Economics and emissions
Eighth graders produce a manufactured good and monitor energy consumption. In this Math lesson, 8th graders practice their basic math and accounting skills. Students participate in a business simulation.
Curated OER
Shackleton's Antarctic Adventure
Learners research the exploration of Antarctica by the explorer Sir Ernest Shackelton. In this Antarctic exploration lesson, students watch a movie about Sir Ernest Shackelton and his ship the Endurance. Learners study a map of...
Curated OER
Latent Heat and Clouds
Students explore latent heat and how it relates to clouds in the atmosphere. In this earth science lesson students investigate how clouds are formed. Students examine clouds and the water cycle.
Curated OER
Energy: Eco-Icons that Electrify
Learners examine environmental issues. In this energy lesson, students explore the topic of energy conservation and then create marketing (to be implemented in their school) meant to communicate the benefits of energy conservation.
Curated OER
Create a Cloud in a Jar (Hands-on Version)
Students examine the conditions necessary for cloud formation. In this clouds lesson students complete an activity that shows them atmospheric pressure.
Curated OER
Microsoft Publisher Country Brochure
Students explore geographic information. In this geography and technology lesson, students choose a county and answer related questions on a Webquest. Students create a word web and design a country brochure.
Curated OER
Utah's Own
Fourth graders examine the effects of humans on the environment. In this Social Studies lesson, 4th graders analyze human changes to the environment. Students explore the actions and effects at a community level.
Curated OER
Some Like it Cold: Canada's Northern Communities
Fifth graders examine cultures close to the arctic circle. In this geography lesson, 5th graders consider the impact of climate on cultural development of arctic communities. Students research a given community and present their findings...
Curated OER
(S-1B) Global Climate, Global Wind Flow
Students discuss how the horizontal transport of heat from equatorial regions polewards drives global wind systems.
Curated OER
Are the World's Weather And Climate Changing?
Students conduct research about an assigned weather topic and create an interactive project/presentation that can be used to teach classmates about a weather topic. They work with a partner or group to teach classmates about the selected...
Curated OER
Graphing Climate Information
Seventh graders plot the data for the average monthly precipitation for three cities. They make a graph using a spreadsheet.
Curated OER
Interpreting Graphs: Temperate Climates
In this interpreting graphs worksheet, students read a graph containing data of rainfall and temperature, then complete 18 questions, interpreting the data.
Other popular searches
- Global Climates
- Different Climates
- Climates of the World
- Comparing Climates
- World Climates
- Climates and Biomes
- Climates and Bio Mes
- Weather and Climates
- Adaptations to Cold Climates
- U.s. Climates
- African Climates
- Houses in Different Climates


