Curated OER
Graphing
Students investigate graphing. In this bar graph lesson, students view an informational website about graphing, then construct a class birthday bar graph outside with sidewalk chalk. Students choose a survey topic, then collect...
Curated OER
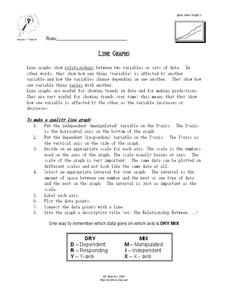
Line Graphs
In this algebra worksheet, students describe the relationship between a line graph and its data. They define the reasons line graphs are used and discuss increasing and decreasing lines. There is one involved questions, requiring several...
Curated OER
Stories to Graphs
Students graph their solutions using a linear equation. In this algebra lesson, students rewrite words problems into algebraic equations and graph their solutions. They solve word problems dealing with real lie scenario.
Curated OER
Graphing and Analyzing Biome Data
Students explore biome data. In this world geography and weather data analysis lesson, students record data about weather conditions in North Carolina, Las Vegas, and Brazil. Students convert Fahrenheit degrees to Celsius degrees and use...
Curated OER
Graphing Sea Ice Extent in the Arctic and Antarctic
Students graph sea ice data and predict long term trends in the data. In this climate change lesson, students use sea ice data from the Arctic and Antarctic to construct line graphs. They use their graphs to predict the effects of global...
Curated OER
Graphs of Direct Variation
Students identify graphs for direct variation. In this algebra worksheet, students analyze graphs to determine their direct variation. They also determine whether the graphs are functions or not.
Curated OER
Analyzing Graphs of Two Equations
Students analyze graphs of two equations. In this algebra lesson, students rewrite word problems as linear equations. They graph their solution and compare and contrast the two items being represented.
Curated OER
Favorite Days of the Week
In this bar graph worksheet, students use the blank graph to survey classmates and record their favorite day of the week. Students think of one question about the graph and write it on the line.
Curated OER
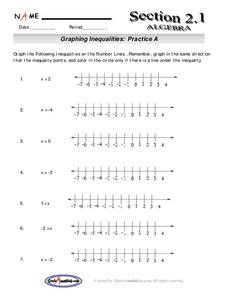
Graphing Inequalitites
Ninth graders graph inequalities. In this algebra lesson, 9th graders graph equations on a number line using inequalities and plain numbers. They solve inequalities with negative numbers also.
Curated OER
Graphs and Direct Variation
Students solve problems with direct variation. For this algebra lesson, students analyze graphs to figure out the direct variation of a line. They observe the slopes based the steepness of the lines.
Curated OER
Graphing With Paper and Computers
Fourth graders construct bar graphs. In this graphing lesson, 4th graders create bar graphs in connection with the story, The Copycat Fish. After creating the initial graphs on paper, students use MS Excel to create graphs.
Curated OER
Data Analysis Challenge
In this data analysis worksheet, young scholars work with a partner to collect information for a survey. The information is then compiled into a graph. Students must indicate their survey question, the target audience, predict the...
Curated OER
Building a Quadratic Function Form
Comparing the movement of graphs geometrically when small changes are made to the parent function motivates this collaborative discussion on the transformations of functions to their various forms. Vertical and horizontal shifts due to...
Curated OER
Another Way of Factoring
Focusing on this algebra lesson, learners relate quadratic equations in factored form to their solutions and their graph from a number of different aspects. In some problems, one starts with the original equation and finds the...
Curated OER
Find Parabolas through Two Points
Your learners will write quadratic functions whose graphs include specific points and explore how these graphs are related to each other.
Curated OER
Voter Turnout
Explore politics by analyzing the voting process. Pupils discuss the purpose of casting votes in an election, then examine graphs based on the data from a previously held election's turnout. The lesson concludes as they answer study...
Curated OER
A Saturating Exponential
Your learners analyze the familiar model of a cold beverage warming when it is taken out of the refrigerator. The general form of the equation and its graph are presented. Learners learn about the specific pieces of the function by...
Curated OER
Bubbles Galore
Students investigate bubbles. In this science lesson, students observe how long bubbles last and graph the results of the experiment.
Curated OER
Investigation - The M & M Mystery
Sixth graders inspect M&M's to complete statistical data. Students interpret percent of colors represented. They convert data from decimals, fractions, and percents. Using the data, 6th graders create a bar graph and a circle graph.
Curated OER
How Much Folate?
This task includes scaffolding to support the introduction of the writing and graphing of linear inequalities. Then your geometry learners discover that writing down all possible combinations is not feasible so they are led to use...
Curated OER
M & M Madness
M&M's are always a great manipulative to use when teaching math. In this graphing lesson plan, learners predict how many of each color of M & M's there are. They count up each color and plug the data into a graph using the...
Curated OER
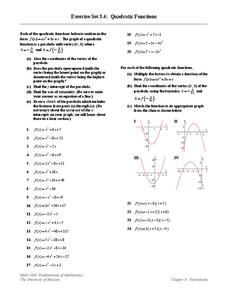
Quadratic Functions
In this graphing quadratic equations worksheet, learners find the vertex and graph the parabola for 24 quadratic equations. The final four are factored into binomials to increase accuracy of the x intercepts.
Curated OER
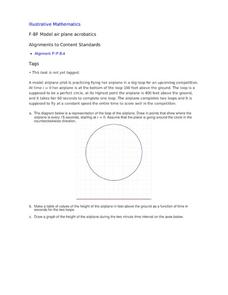
Model Air Plane Acrobatics
Your young airplane enthusiasts will enjoy this collaborative task of graphing an airplane's distance from the ground as it flies in a perfect circle. They will discover that they have graphed a sinusoidal function that comes from the...
Curated OER
Wind Effects- A Case Study
Students explore hurricanes. In this weather data interpretation lesson, students draw conclusions about the impact of Hurricane Floyd as it related to weather conditions. Students read and interpret a tide data table, a barometric...
Other popular searches
- Coordinate Graphing Pictures
- Graphing Ordered Pairs
- Graphing Skills Lesson Plans
- Coordinate Graphing
- Graphing Linear Equations
- Holiday Coordinate Graphing
- Graphing Linear Inequalities
- Graphing Calculator
- Graphing Inequalities
- Halloween Math Graphing
- Graphing Mean, Median, Mode
- Graphing Data


